The Economics and Statistics Division maintains archives of previous publications for accountability purposes, but makes no updates to keep these documents current with the latest data revisions from Statistics Canada. As a result, information in older documents may not be accurate. Please exercise caution when referring to older documents. For the latest information and historical data, please contact the individual listed to the right.
<--- Return to Archive
For additional information relating to this article, please contact:
March 02, 2020NON-RESIDENTIAL FIXED CAPITAL INVESTMENT, ANNUAL 2019 Non-residential fixed capital investment consists of expenditures made by business, governments and non-profit institutions serving households that add to the capital stock for production of goods and services in an economy. Investment that are included are buildings, engineering construction (i.e. bridge, mine structure), machinery and equipment and intellectual property products (i.e. software, mineral exploration) but it doesn’t include non-reproducible assets (lands, mineral deposits, natural resources) or housing investment. Statistics Canada has begun to release quarterly data on non-residential fixed capital investment and stock for the provinces with historical data back to 2013. Note, the data is not seasonally adjusted and expressed in current prices.
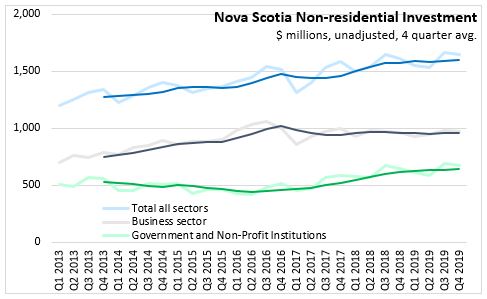
Nova Scotia non-residential investment has trended upwards since Q1 2013, rising from $1,201 million in Q1 2013 to $1,645 million in Q4 2019 but with some short-term periods of lift and decline that are likely associated with specific large projects. Business sector non-residential investment trended upward from 2013 to 2016 but remained flat thereafter. Government and non-profit institution serving households was mostly flat from 2013 through 2017 but has been at higher level over 2018 and 2019.
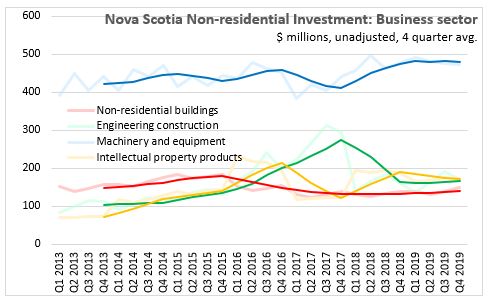
Within the business sector, machinery and equipment account for majority of fixed capital investments with the trend moving upwards since a low in 2017. Engineering construction was higher in 2017 and declined in 2018. Intellectual property product investment was elevated in 2016 and 2018 as offshore exploration expenses were reported in these years. Non-residential building construction trended downwards after 2015.
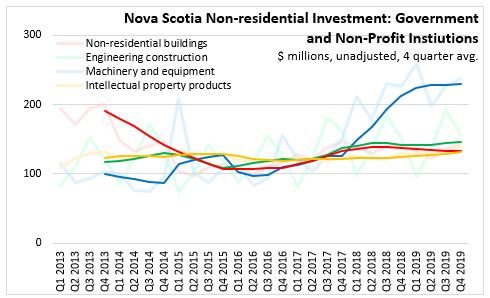
Government investment in machinery and equipment rose through 2018 and has maintained an elevated levels though 2019 at around $230 million per quarter. Government non-residential buildings, engineering construction and intellectual property products contribute similar values and have been flat in recent years.
ANNUAL 2019
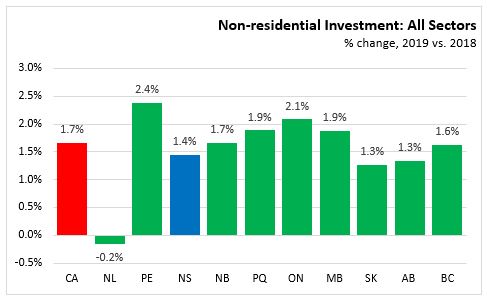
All provinces, except Newfoundland and Labrador (-0.2%), had increases in non-residential investment in 2019 compared to 2018. The largest increase in percentage terms was in Prince Edward Island (+2.4%) while the slowest was in Saskatchewan and Alberta (both +1.3%).
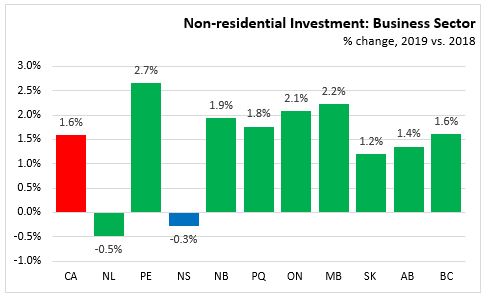
Business sector investment was up 1.6 per cent in Canada in 2019 with growth in eight provinces but declines in Newfoundland and Labrador (-0.5%) and Nova Scotia (-0.3%). The fastest growth in Prince Edward Island (+2.7%).
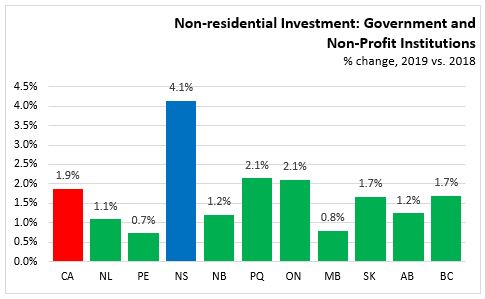
Government fixed capital investment was up 1.9 per cent in Canada in 2019 with increases in all provinces. The largest percentage increase in government and non-profit institutions capital investment was in Nova Scotia (+4.1%) and the slowest was in Prince Edward Island (+0.7%).
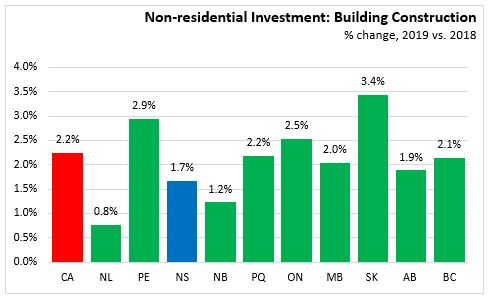
For 2019, non-residential investment in buildings, engineering construction and machinery and equipment were up in all provinces. Building construction increased the most in Saskatchewan (+3.4%) and the least in Newfoundland and Labrador (+0.8%).
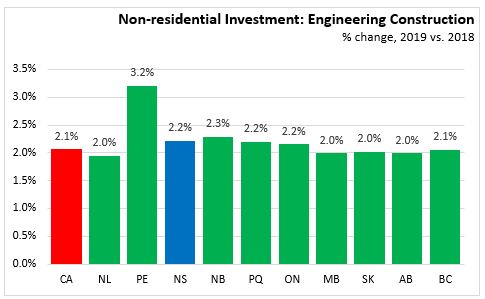
Increased investments in engineering and machinery and equipment in Prince Edward Island helped to drive the province to having the fastest growth while all other provinces had similar growth rates.

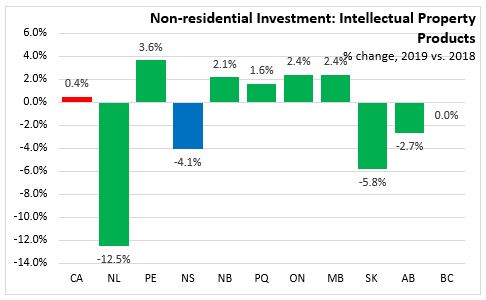
Intellectual property products increased 0.4 per cent in Canada in 2019 with increases in five provinces – Prince Edward Island, New Brunswick, Quebec, Ontario, and Manitoba. Intellectual property products is influenced by mineral and energy exploration activity that occurs. Declines in IPP for Newfoundland and Labrador, Nova Scotia, Saskatchewan and Alberta in 2019 are likely due to lower exploration.
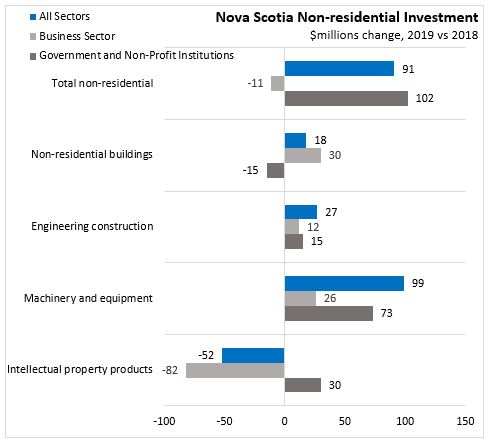
For Nova Scotia in 2019, total non-residential investment in fixed capital was up 1.4 per cent or $91 million to $6,397 million. In 2019, non-residential investment the business sector ($3,829 million), accounted for 60 per cent and the government sector ($2,550 million) and non-profit institutions ($16 million) accounted for 40 per cent.
Business sector non-residential investment declined 0.3 per cent or $11 million in 2019. Within the business sector the decline in intellectual property products (-$82 million) offset increases in buildings (+$30 million), engineering construction (+$12 million) and machinery and equipment (+$26 million)
Government and non-profit institutions investment increase 4.1 per cent or $102 million. There was a decrease of 2.7 per cent or $15 million in non-residential buildings that was offset with growth in engineering construction (+$15 million) machinery and equipment (+$73 million) and intellectual property products (+$30 million).

Statistics Canada. Table 34-10-0163-01 Flows and stocks of fixed non-residential and residential capital, by sector and asset, provincial and territorial (x 1,000,000)
<--- Return to Archive