The Economics and Statistics Division maintains archives of previous publications for accountability purposes, but makes no updates to keep these documents current with the latest data revisions from Statistics Canada. As a result, information in older documents may not be accurate. Please exercise caution when referring to older documents. For the latest information and historical data, please contact the individual listed to the right.
<--- Return to Archive
For additional information relating to this article, please contact:
March 03, 2020CANADA'S BALANCE OF INTERNATIONAL PAYMENTS ANNUAL 2019 CANADA ANNUAL 2019
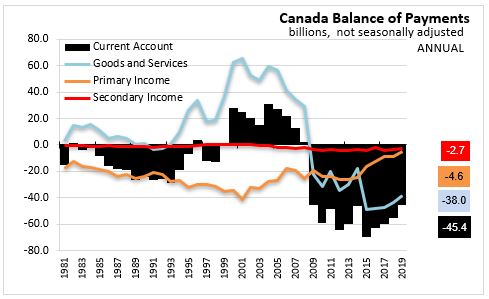
In Canada 2019, the seasonally adjusted current account.
- Receipts increased 3.8% ($32.4 billions) over 2018 to $892.3 billion while
- Payments trade increased 2.4% ($22.3 billions) over 2018 to $937.7 billion.
- Current account trade deficit narrowed by $10.1 billions over 2018 to $45.4 billion.

In 2019, Exports G&S trade increased 2.1% ($14.7 billions) over 2018 to $728.1 billion. while Imports G&S trade increased 1.2% ($9.2 billions) over 2018 to $766.1 billion. G&S trade deficit narrowed by $5.5 billions over 2018 to $38.0 billion.
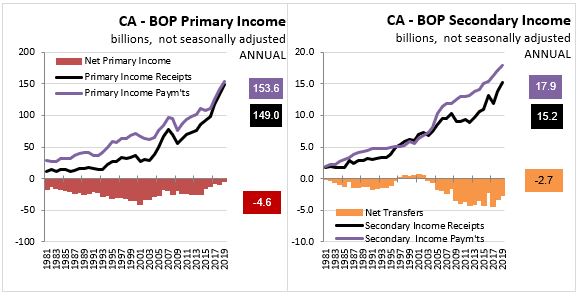
Exports Primary trade increased 12.3% ($16.3 billions) over 2018 to $149.0 billion. Imports Primary trade increased 8.7% ($12.3 billions) over 2018 to $153.6 billion. Primary trade deficit narrowed by $4.0 billions over 2018 to $4.6 billion.
Exports Secondary trade increased 10.3% ($1.4 billions) over 2018 to $15.2 billion. Imports Secondary trade increased 4.8% ($0.8 billions) over 2019 Q3 to $17.9 billion. Secondary trade deficit narrowed by $0.6 billions over 2018to $2.7 billion.
Balance of Payments to GDP Ratio
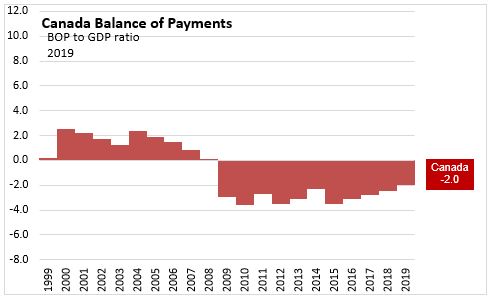
Over the period 1999 to 2008, Canada's Balance of payments to GDP ratio was positive, rangging from 2.54 (2000) to 0.12 (2008). In 2008 there was a global recession in international trade. In 2009, Canada reported a balance of payments to GDP ratio of -2.91. Over the period 2009 to 2019, the ratio has remained negative, with progressive narrowing of the ratio as trade and the balance of payments improved. In 2019, Canada's balance of payments to GDP ratio had narrowed to a negative 1.98.
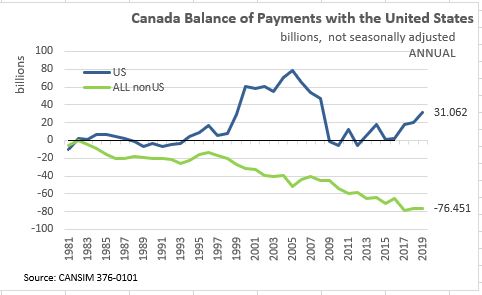
Canada's international trade is split between two major markets: the United States and the rest of the world. While Canada's current account with the United states is positive ($31.1 billion), while Canada's balance of payments with the rest of the world is neagative (-$76.5 billion).
Annual Balance of Payments Between Canada and the United States
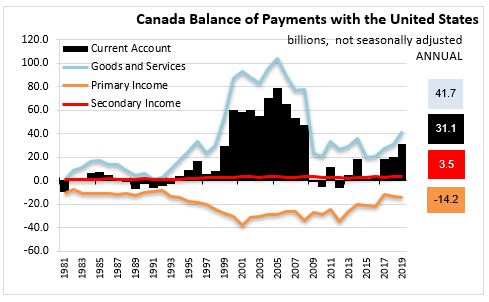
In Canada 2019, the seasonally adjusted current account with the United States,
- Receipts increased 3.3% ($18.7 billions) over 2018 to $592.7 billion.
- Payments trade increased 1.5% ($8.1 billions) over 2018 to $561.6 billion.
- Current account trade surplus widened by $10.6 billions over 2018 to $31.1 billion.
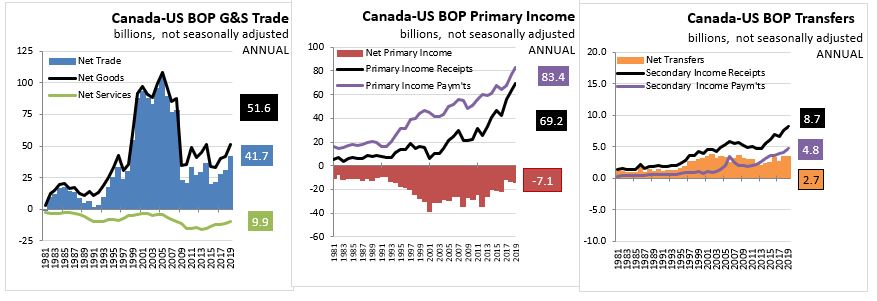
In 2019, Exports G&S trade increased 2.4% ($12.3 billion) over 2018 to $515.2 billion. while Imports G&S trade increased 0.3% ($1.2 billion) over 2018 to $473.5 billion. G&S trade surplus widened by $11.1 billion over 2018 to $41.7 billion.
Exports Primary trade increased 9.0% ($5.7 billion) over 2018 to $69.2 billion. Imports Primary trade increased 8.1% ($6.3 billion) over 2018 to $83.4 billion. Primary trade deficit widened by $0.5 billion over 2018 to $14.2 billion.
Exports Secondary trade increased 8.6% ($0.7 billion) over 2018 to $8.3 billion. Imports Secondary trade increased 14.3% ($0.6 billion) over 2018 to $4.8 billion. Secondary trade surplus widened by $0.1 billion over 2018 to $3.5 billion.
Annual Balance of Payments Between Canada and non-US Countries
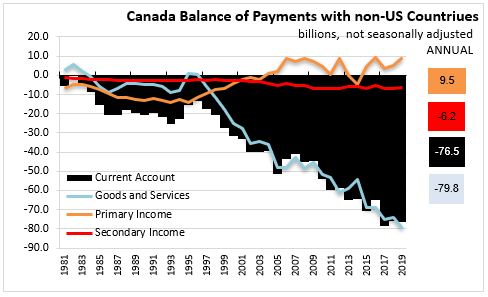
In Canada 2019, the seasonally adjusted current account with non-US countries, .
- Receipts increased 4.8% ($13.7 billion) over 2018 to $299.6 billion.
- Payments trade increased 3.9% ($14.2 billion) over 2018 to $376.1 billion.
- Current account trade deficit widened by $0.5 billion over 2018 to $76.5 billion.
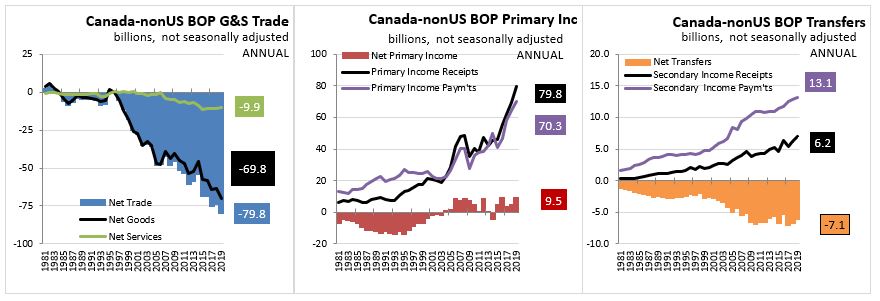
In 2019, Exports G&S trade increased 1.1% ($2.4 billion) over 2018 to $212.9 billion. while Imports G&S trade increased 2.8% ($8.0 billion) over 2018 to $292.6 billion. G&S trade deficit widened by $5.5 billion over 2018 to $79.8 billion.
Exports Primary trade increased 15.2% ($10.5 billion) over 2018 to $79.8 billion. Imports Primary trade increased 9.3% ($6.0 billion) over 2018 to $70.3 billion. Primary trade surplus widened by $4.5 billion over 2018 to $9.5 billion. .
Exports Secondary trade increased 12.4% ($0.8 billion) over 2018 to $6.9 billion. Imports Secondary trade increased 1.7% ($0.2 billion) over 2018 to $13.1 billion. Secondary trade deficit narrowed by $0.5 billionsover 2018 to $6.2 billion.
REFERENCES
Statistics Canada
Table: 36-10-0018-01 Quarterly
Table: 36-10-0016-01 Quarterly by country (i.e US, ALL)
OECD
Table: Balance of Payments BPM6: Current account balance as a % of GDP
<--- Return to Archive