The Economics and Statistics Division maintains archives of previous publications for accountability purposes, but makes no updates to keep these documents current with the latest data revisions from Statistics Canada. As a result, information in older documents may not be accurate. Please exercise caution when referring to older documents. For the latest information and historical data, please contact the individual listed to the right.
<--- Return to Archive
For additional information relating to this article, please contact:
April 22, 2020NEW HOUSING PRICE INDEX, MARCH 2020 MARCH 2020
Statistics Canada noted that the COVID-19 had no known impact on new house prices in March, as the outbreak was declared a pandemic on March 11, toward the end of the reference period for the New Housing Price Survey. Builders across the country were still operating normally and all of their home sales centres were open during the reference period (February 16 to March 15).
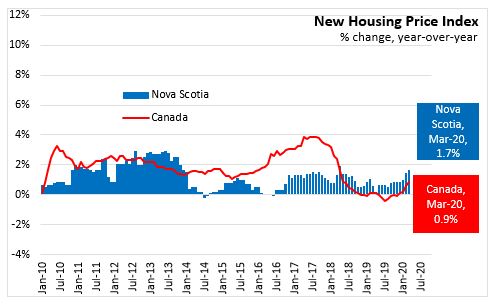
In March 2020, the price of new housing was up 0.2 per cent in Nova Scotia compared to the previous month, while the national index increased 0.3 per cent.

In Nova Scotia, new housing prices were 1.7 per cent higher than they were in March 2019. National new housing prices increased 0.9 per cent, year over year.
Year-over-Year (March 2020 vs. March 2019)
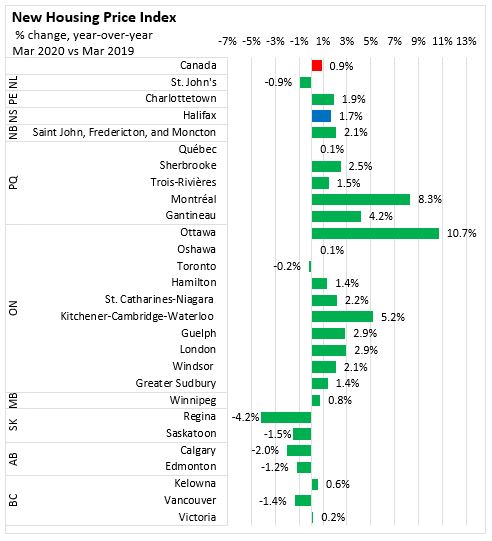
For year-over-year, Nova Scotia's new housing prices were up 1.7 per cent compared to March 2019. National new housing prices were up 0.9 per cent. Quebec saw the fastest growth in new housing prices at 6.2 per cent. New housing prices are lower in Saskatchewan, Alberta, British Columbia, and Newfoundland and Labrador.

Census Metropolitan Areas
Comparing March 2020 to March 2019, price growth among Census Metropolitan Areas was fastest in Ottawa, Montreal, and Kitchener-Cambridge-Waterloo. New housing prices declined the most in Regina, Calgary, Saskatoon, and Vancouver. New housing prices were down in all CMAs in Saskatchewan and Alberta. New housing price index also declined in Vancouver (-1.4%), St. John's (-0.9%), and Toronto (-0.2%).
Statistics Canada Note: With the release of the January 2017 NHPI data, a number of important changes have been introduced to increase the relevance of the index series. The index base period, for which the NHPI equals 100, is now December 2016. The NHPI basket has been updated with new weights for the 2017 series, its coverage has been expanded to include new CMAs.
Source Statistics Canada. Table 18-10-0205-01 New housing price index, monthly
<--- Return to Archive