The Economics and Statistics Division maintains archives of previous publications for accountability purposes, but makes no updates to keep these documents current with the latest data revisions from Statistics Canada. As a result, information in older documents may not be accurate. Please exercise caution when referring to older documents. For the latest information and historical data, please contact the individual listed to the right.
<--- Return to Archive
For additional information relating to this article, please contact:
May 08, 2020BUILDING PERMITS, MARCH 2020 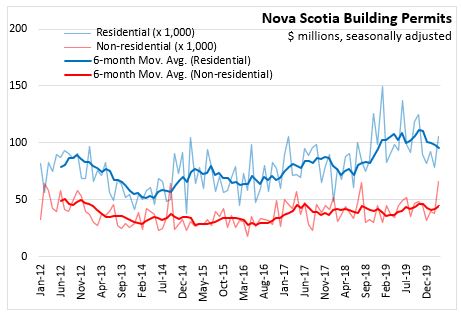
The monthly value of building permits (seasonally adjusted) issued in Nova Scotia increased 47.8 per cent in March, following a (revised) decrease of 11.9 per cent in February. Nova Scotia's residential permits increased 35.6 per cent while non-residential building permits increased 72.8 per cent. Monthly results for building permits are highly volatile.
The six-month moving average of residential permits trended modestly upwards through 2017 and then declined in early 2018. Afterwards, residential permits resumed an upward trend before flattening out over the 2019. The six-month moving average for non-residential permit values remained relatively flat from mid-2017 to late 2018. Since early 2019, non-residential permits have trended upward but have peaked at the end of the year and declined in 2020.
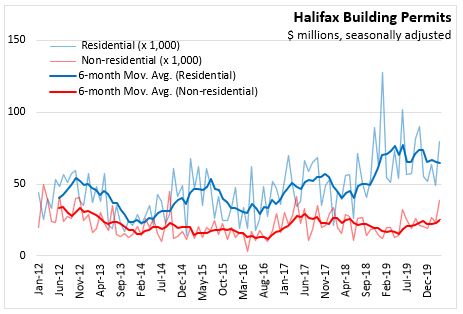
The trend in Nova Scotia building permit values largely reflects the trends in the Halifax market. The value of Halifax building permits increased 63.1 per cent in March 2020, reflecting a 61.4 per cent increase in residential permit values and a 66.6 per cent in non-residential permit values.
The six-month moving average for residential permits in Halifax has been rising since mid-2016 except for a decline in the fall of 2017 and early 2018. Since then, Halifax residential permits trended upward before flattening out over the 2019. Non-residential permits in Halifax trended down starting in June 2017, though they have trended upward since the spring of 2019.
Outside the Halifax market, building permit values increased 22.4 per cent in March 2020, reflecting a decline in residential permits (-8.3 per cent) and a rise in non-residential permits (+82.6 per cent). Non-residential permits trended upward outside of Halifax from mid-2017 to mid-2018 but have remained relatively flat since then. Residential permits were elevated for a period in 2019 and have been declining in recent months.

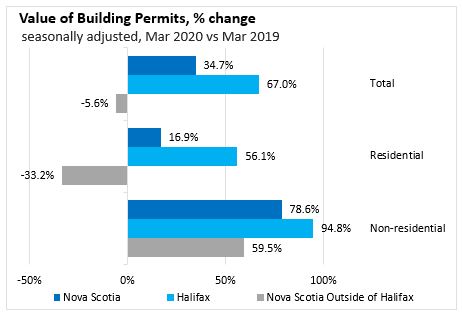
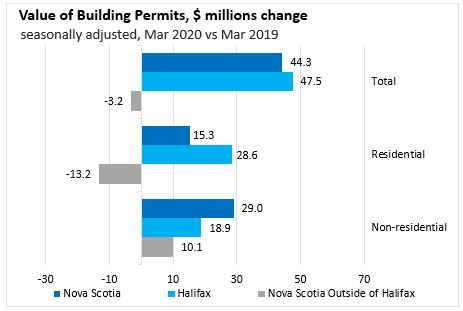
In March 2020, the value of Nova Scotia building permits was up 34.7 per cent compared to March 2019. Residential permits are up 16.9 per cent and non-residential permits are up 78.6 per cent for March 2020 vs March 2019. The increase in non-residential building permits reflect a rise in commercial (+103.9%) and industrial (+39.9%) and decline in institutional (-45.8%)
Halifax building permits were up 67.0 per cent in March 2020 as residential permits increased 56.1 per cent and non-residential 94.8 per cent increased compared to March 2019. Building permits outside of Halifax were down 5.6 per cent.
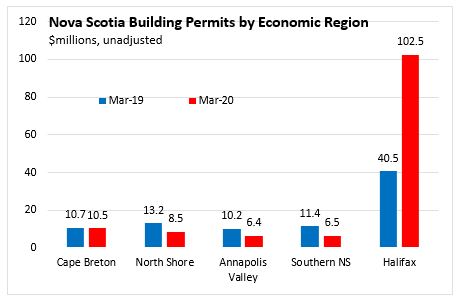
Building permits in Nova Scotia's five economic regions totaled $134.2 million (unadjusted) in March 2020. The largest contributor was the Halifax region, with a combined residential and non-residential permit value of $102.5 million. In March 2020, the total value of residential and non-residential permits was up in Halifax region. Total permits declined in Southern NS, Annapolis Valley,North Shore, and Cape Breton region, compared to March 2019.
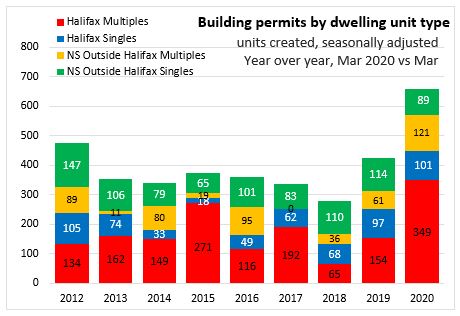
In March 2020, the number of residential dwelling-units created (seasonality adjusted) in Nova Scotia was up by 235 units compared to the March 2019. The number of single units was up for Halifax (+4) and down for Nova Scotia outside of Halifax (-25). The number of multiple units created was up for both Halifax (+195) and Nova Scotia outside of Halifax (+60).
Nationally, residential building permit values (seasonally adjusted) were on an upward trend in 2016 but have levelled off since early 2017. National residential building permits were down 13.1 per cent in March. Non-residential building permit values rose through 2017 and peaked toward the end of the year, remaining relatively flat through 2018. Since the end of 2018, non-residential permits have risen modestly. National non-residential permit values were down 13.3 per cent in March.

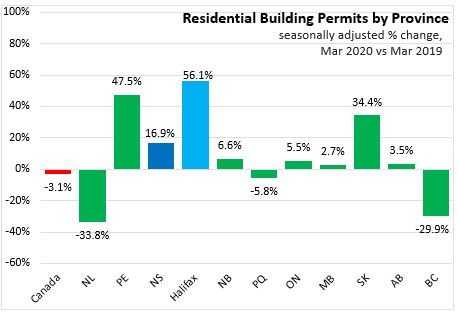
Comparing March 2020 with March 2019, national residential building permit (seasonality adjusted) values were down 3.1 per cent, with increases in seven provinces. Prince Edward Island (+47.5 per cent) showed the largest gain in residential permits in percentage terms, followed by Saskatchewan (+34.4 per cent) and Nova Scotia (+16.9 per cent). Newfoundland Labrador (-33.8 per cent) showed the largest decline, followed by British Columbia (-29.9 per cent).
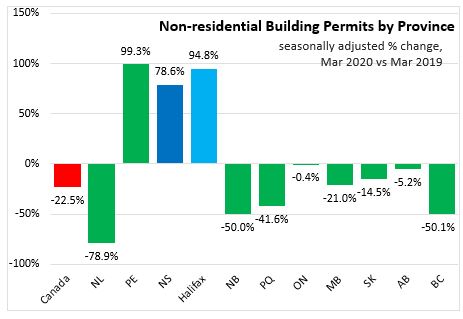
National non-residential permits (seasonality adjusted) are down 22.5 per cent in March 2020 compared with March 2019. Non-residential permits in Prince Edward Island increased (+99.3 per cent) and Nova Scotia (+78.6 per cent). Newfoundland and Labrador (-78.9 per cent) had the largest decline followed by New Brunswick (-50.0 per cent) and British Columbia (-50.1 per cent).
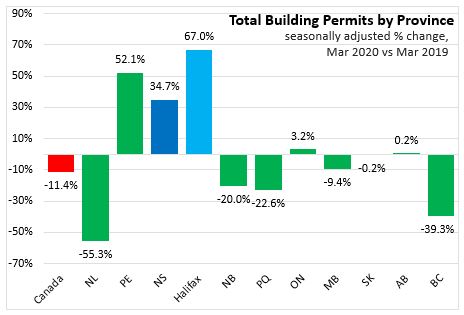
In March 2020, the national value of total (residential and non-residential) building permits was down 11.4 per cent compared to March 2019. Total building permit values were up in four provinces in March 2020, Prince Edward Island led with (+52.1 per cent) followed by Nova Scotia (+34.7 per cent). Newfoundland and Labrador reported the largest decline over this period (-55.3 per cent), followed by British Columbia (-39.3 per cent).
Source: Statistics Canada Table 34-10-0066-01
<--- Return to Archive