The Economics and Statistics Division maintains archives of previous publications for accountability purposes, but makes no updates to keep these documents current with the latest data revisions from Statistics Canada. As a result, information in older documents may not be accurate. Please exercise caution when referring to older documents. For the latest information and historical data, please contact the individual listed to the right.
<--- Return to Archive
For additional information relating to this article, please contact:
June 12, 2020CANADA NATIONAL BALANCE SHEET ACCOUNTS, Q1 2020 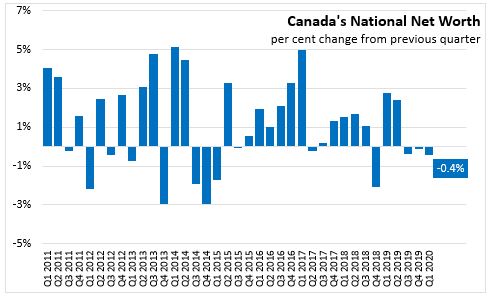
In the first quarter of 2020, Canadian national wealth declined 0.4 per cent (or $49.6 billion) to $11,706.0 billion. This follows a revised decrease of 0.1 per cent in the fourth quarter of 2019. As with the previous quarter, the negative growth was largely attributable to a decrease in the value of natural resource assets, it is the third consecutive quarterly decline. Real estate asset values increased by $103.5 billion, despite residential sales volumes being moderated in March by the implementation of COVID-19-related restrictions. Net foreign assets decreased as equity markets fell substantially in March.
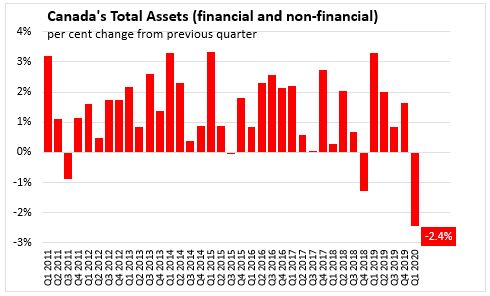
Total assets, including financial and non-financial assets decreased by 2.4 per cent to $44,687 billion at the end of Q1 2020.
Household sector
"In Q1 2020, Canada’s household sector net worth declined by $443.4 billion to $11,293.9 billion. Financial assets declined $532.0 billion, as its main contributors were downward revaluations in equity and investment funds shares due to investors reaction to increased economic uncertainty.
On the domestic side, the Toronto Stock Exchange (TSX) decreased 21.6 per cent by the end of the first quarter, including a 17.7% monthly decline in March. However, the TSX showed signs of recovery after the quarter, recovering some of the lost ground in April (+10.5 per cent). As global stock markets experienced considerable losses, Canadian investors shed a record dollar amount of foreign shares from their holdings in March and saw the value of their holdings decline significantly. On a per capita basis, household net worth fell from $309,735 to $297,266.
Currency and deposit assets increased 3.2 per cent in the first quarter, the largest quarterly increase recorded, as households reacted to the effects of the COVID-19 pandemic. The household savings rate increased from 3.6 per cent to 6.1 per cent in the first quarter, mainly as a result of a record decrease in household spending (-2.1 per cent).
The value of non-financial assets grew $102.9 billion in the first quarter, largely attributable to an increase of $77.4 billion in residential real estate, with strong price growth in January and February 2020 that carried through to the end of the quarter. Residential sales volumes, reflecting activity in the housing market, were 37.3 per cent higher in January and February 2020 than the same period in 2019. Meanwhile, March 2020 saw a year-over-year increase of 22.0 per cent in sales volumes relative to March 2019.
Household borrowing increased $1.9 billion to $27.6 billion in Q1 2020. Consumer credit and non-mortgage lending declined to $4.5 billion in total while mortgage lending increased to $23.1 billion." (Statistics Canada)
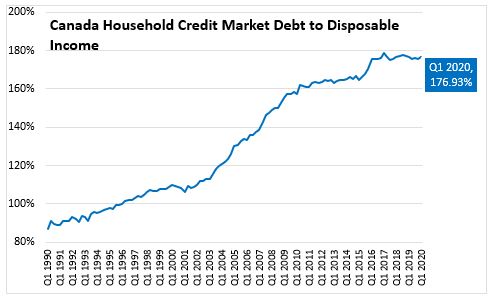
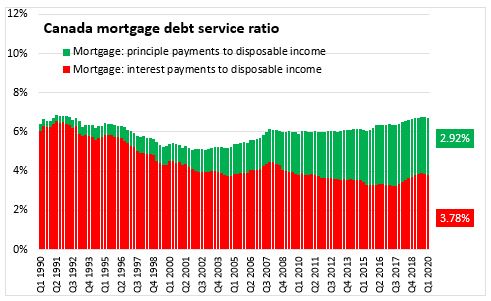
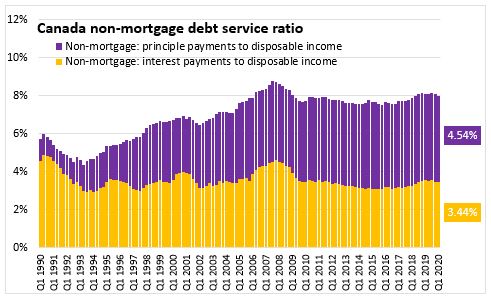
Household credit market debt as a proportion of household disposable income increased to 176.93 per cent in Q1 2020.
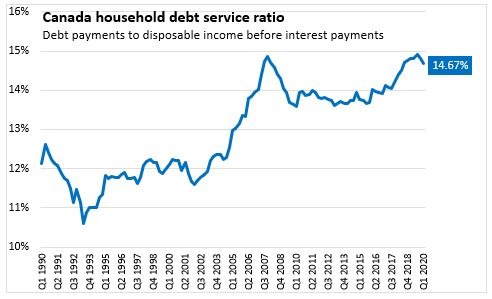
In Q1 2020, household debt payments declined from 14.81 per cent to 14.67 per cent of disposable income (before interest payments). Payment deferrals related to the COVID-19 had a slight impact in the quarter, reducing the obligated principal; this is expected to continue in subsequent quarters.
Government sector
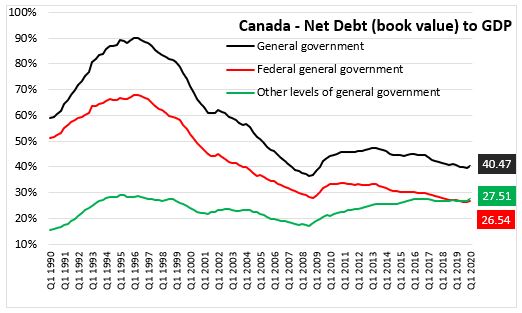
At the end of Q1 2020, general government net debt (book value) increased to 40.47 per cent of GDP. The federal government's net debt to GDP ratio increased to 26.54 per cent, as federal government net debt increased and GDP was impacted by COVID-19-related shutdowns. Net debt of other levels of government is now larger than Federal government debt at 27.51 per cent of GDP.
Corporate sector
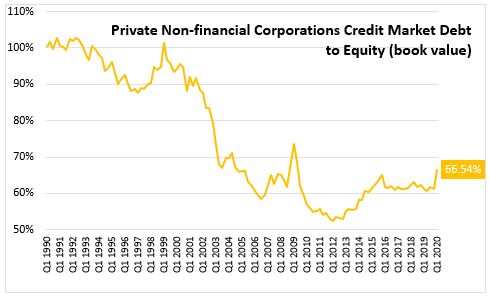
The credit market debt to equity ratio of non-financial private corporations increased to 66.54 cents of credit market debt for every dollar of equity in the Q1 2020, up from 61.19 cents (revised) in Q4 2019.
Statistics Canada: Daily
Table 11-10-0065-01 Debt service indicators of households, national balance sheet accounts
Table 36-10-0580-01 National Balance Sheet Accounts (x 1,000,000)
Table 38-10-0235-01 Financial indicators of households and non-profit institutions serving households, national balance sheet accounts
Table 38-10-0236-01 Financial indicators of corporate sector, national balance sheet accounts
Table 38-10-0237-01 Financial indicators of general government sector, national balance sheet accounts
Table 38-10-0238-01 Household sector credit market summary table, seasonally adjusted estimates
<--- Return to Archive