The Economics and Statistics Division maintains archives of previous publications for accountability purposes, but makes no updates to keep these documents current with the latest data revisions from Statistics Canada. As a result, information in older documents may not be accurate. Please exercise caution when referring to older documents. For the latest information and historical data, please contact the individual listed to the right.
<--- Return to Archive
For additional information relating to this article, please contact:
September 15, 2020MANUFACTURING SHIPMENTS, JULY 2020 Month-over-month (Jul20 vs Jun20)
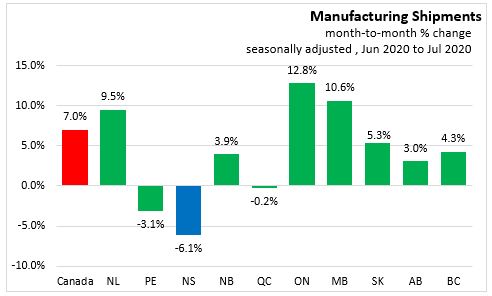
Nova Scotia's manufacturing shipments were $711.8 million in Jul20, a 6.1% decrease from Jun20. Durable goods shipments decreased by 17.2% while non-durables fell by 0.6%.
Canada's manufacturing shipments were $53.13 billion, a 7.0% increase from June to July. Durable goods shipments increased 10.4% while non-durables increased 3.3%. Shipments were up in 7 of 10 provinces, with the largest increase in Ontario. The largest decline was in Nova Scotia.
Year-over-year (Jul20 vs Jul19)

Nova Scotia's manufacturing shipments were 10.6% below Jul19 levels.
National shipments were 6.9% below Jul19 levels, with declines reported in every province. The largest declines were reported in Newfoundland and Labrador while the smallest were reported in Ontario.
Trends
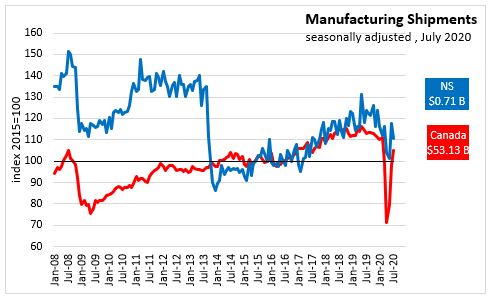
Nova Scotia's seasonally adjusted manufacturing shipments had a relatively modest decline during the most severe COVID-19 restrictions. As of July, Nova Scotia's manufacturing shipments were 1.2% below Feb20 levels. National manufacturing shipments were 5.4% below Feb20 levels. Among provinces, only Ontario's manufacturing shipments have recovered to Feb20 levels.
In addition to rising manufacturing shipments, Canada's new orders for manufacturing increased by 9.0% while unfilled orders fell by 1.2%. Manufacturing inventories declined by 0.8%.

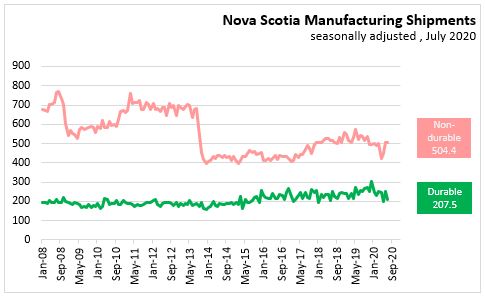
Sectors Year-over-year (Jul20 vs Jul19, seasonally adjusted)
Nova Scotia's durable goods shipments were down 18.8 per cent from July 2019. Non-durable shipments were 6.7 per cent lower than July 2019.
Sectors Year-over-year (Jul20 vs Jul19, unadjusted)

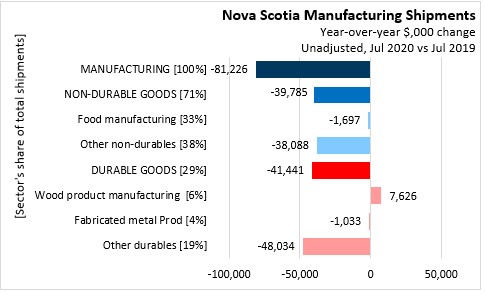
Unadjusted Year-over-year (July 2020 vs July 2019), Manufacturing Shipments decreased 9.7% (-$81.2 million)
- Non-durable goods shipments decreased 6.9% (-$39.8 million)
- Food manufacturing decreased 0.7% (-$1.7 million)
- Other non-durables decreased 11.7% (-$38.1 million)
- Durable goods decreased 16.0% (-$41.4 million).
- Wood product manufacturing increased 21.0% ($7.6 million)
- Fabricated metal Prod decreased 3.5% (-$1.0 million)
- Other durables decreased 24.9% (-$48.0 million)
CENSUS METROPOLITAN AREAS (Jul20 vs Jul19, unadjusted)
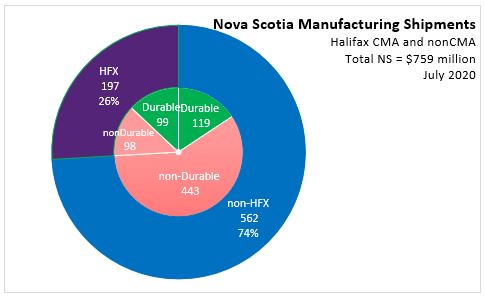

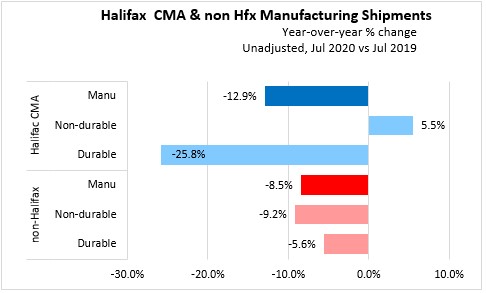
Halifax manufacturing shipments were $196.6 million in Jul20, a 12.9% decline from Jul19. Halifax non-durable shipments have increased 5.5% over Jul19 while durable shipments declined 25.8%.
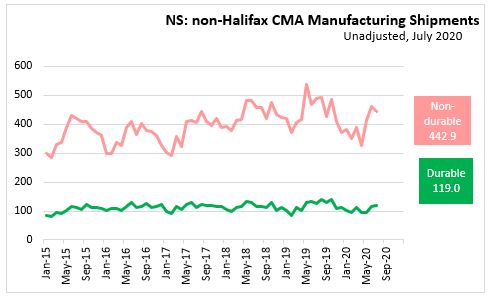
Outside Halifax, manufacturing shipments were $561.9 million in Jul20. Non-durable shipments from manufacturers outside Halifax were down 9.2% from Jul19 while durable shipments were down 5.6%.

During the COVID-19 pandemic, comparisons of year-to-date averages and sums do not show Nova Scotia’s rapidly changing economic situation. The DailyStats will focus on year-over-year comparisons, comparing one month with the same month in the prior year. Where possible the DailyStats will make comparisons of seasonally adjusted data from the pre-COVID-19 period (January and February 2020) with the period during which COVID-19 measures were in place from March 2020 onwards.
STATISTIC CANADA QUOTES
"Following a 16.4% increase in June, sales in Nova Scotia declined 6.1% to $712 million in July on lower transportation equipment."
SOURCES
Statistics Canada Monthly survey of Manufacturing
Statistics Canada. Table 16-10-0047-01 Manufacturers' sales, inventories, orders and inventory to sales ratios, by industry (dollars unless otherwise noted)
Statistics Canada. Table 16-10-0048-01 Manufacturing sales by industry and province, monthly (dollars unless otherwise noted) (x 1,000)
Statistics Canada. Table 16-10-0011-01 Manufacturing sales, by industry for 12 Selected Census Metropolitan Areas (x 1,000)
<--- Return to Archive