The Economics and Statistics Division maintains archives of previous publications for accountability purposes, but makes no updates to keep these documents current with the latest data revisions from Statistics Canada. As a result, information in older documents may not be accurate. Please exercise caution when referring to older documents. For the latest information and historical data, please contact the individual listed to the right.
<--- Return to Archive
For additional information relating to this article, please contact:
September 16, 2020ANALYSIS OF NOVA SCOTIA'S CONSUMER PRICE INDEX FOR AUGUST 2020 TRENDS - AUGUST 2020
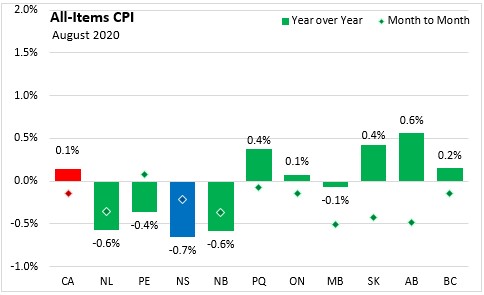
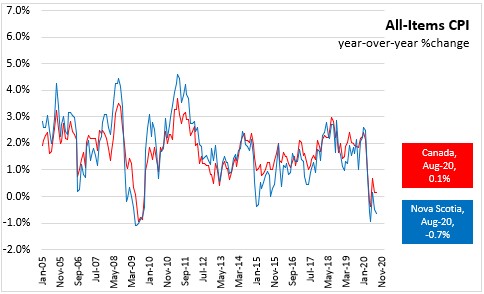
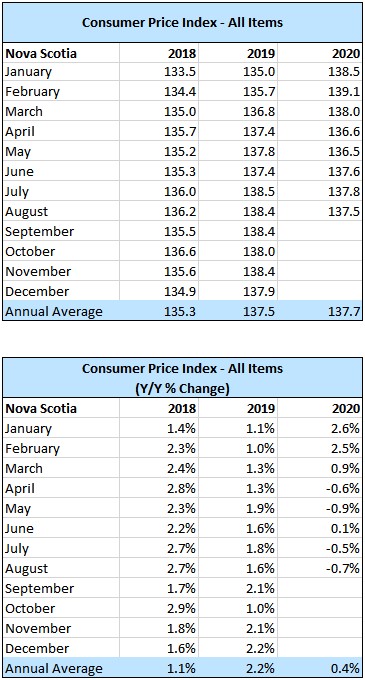
In Nova Scotia the All-Items Consumer Price Index (CPI) decreased 0.7 per cent year-over-year in August 2020, while the national CPI increased 0.1 per cent. Compared to July 2020, monthly consumer prices decreased 0.2 per cent in Nova Scotia and 0.1 per cent nationally.
On a year-over-year basis, national CPI growth was unchanged in August compared to July, with prices up in five of the eight major CPI components.
Gasoline prices (-11.1%) were down year-over-year for the sixth consecutive month. The more moderate year-over-year price decline in August compared to previous months was due to weaker gasoline prices in August 2019, which resulted from higher production and softer international demand.
Increased costs related to safety measures to prevent the spread of COVID-19 contributed to higher personal care service prices, which increased 7.2 per cent year-over-year.
After a year-over-year price decline in July, the first since December 2015, air transportation prices further decreased as various incentives are being offered to encourage people to travel. Compared to August 2019, air transportation prices are down 16.0 per cent.
Passenger vehicle price growth slowed in August on higher rebates offered compared to twelve months prior. Year-over-year, prices of passenger vehicles increased 2.2 per cent in August versus 3.2 per cent in July.
Meat prices returned to pre-COVID levels in August following a large increase in June that was largely due to reduced production of beef. Year-over-year price growth for fresh or frozen beef (+4.8%) slowed as prices continued to fall from the 21.6 per cent year-over-year increase in June.
Impact of COVID-19 on the Consumer Price Index
Statistics Canada continued special CPI program measures for August 2020. In-person field collection was conducted via telephone or internet and supplemented with web scraping, transaction data, and administrative data. Due to COVID-19 impact on product availability, select sub-components of the CPI received temporary special imputations. The sub-indexes for travel tours, spectator entertainment, and use of recreational facilities were imputed from the monthly change in the all-items index - effectively removing the impact of these goods and services on the CPI. Air transportation that was purchased but cancelled is excluded from calculations. Additional details can be found in the technical supplement.
Five provinces reported a year-over-year decline in the All-Item CPI: Nova Scotia (-0.7%), New Brunswick (-0.6%), Newfoundland and Labrador (-0.6%), Prince Edward Island (-0.4%) and Manitoba (-0.1%). The global decline in crude oil prices has resulted in lower prices for gasoline and fuel oils. Gasoline, fuel oils and other fuel prices were major contributors to the year-over-year CPI decline for Atlantic provinces in August. Furnace fuel oil is more commonly used in the Atlantic provinces than in the rest of the country, leading to a higher weight in the CPI basket and greater sensitivity to fluctuations in global oil prices. On a year-over year basis, Nova Scotia gasoline prices were down 16.9 per cent and fuel oil and other fuel prices were down 21.5 per cent in August.
For August 2020, the highest inflation rate was in Alberta (+0.6%), followed by Saskatchewan (+0.4%) and Quebec (+0.4%).
The main contributors to the monthly (August 2020 vs. July 2020) NS CPI movement were:
- Fuel oil and other fuels (+4.4%)
- Personal care services (+7.6%)
- Fresh or frozen chicken (+11.2%)
- Rent (-2.1%)
- Purchase and leasing of passenger vehicles (-1.3%)
- Fresh or frozen beef (-10.2%)
Contributors to the annual (August 2020 vs. August 2019) NS CPI movement were:
- Passenger vehicle insurance premiums (+9.8%)
- Purchase and leasing of passenger vehicles (+1.9%)
- Cigarettes (+6.4%)
- Gasoline (-16.9%)
- Fuel oil and other fuels (-21.5%)
- Traveller accommodation (-36.6%)
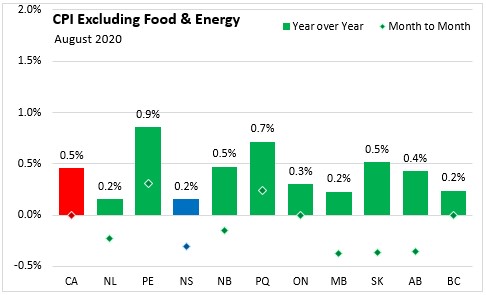
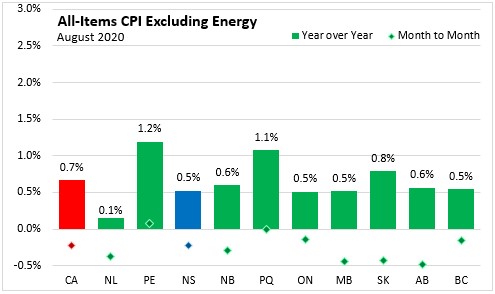
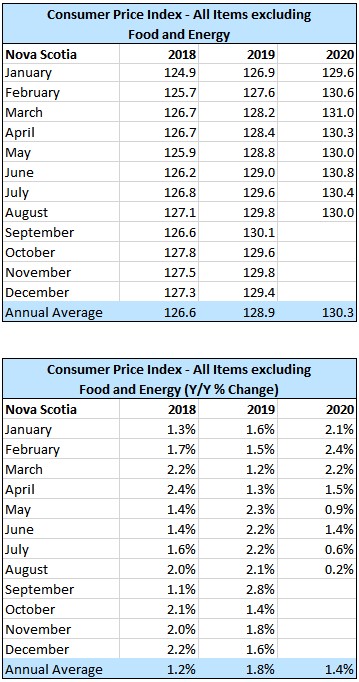
Nova Scotia's consumer price inflation (year-over-year growth in CPI) excluding food and energy was 0.2 per cent in August. All provinces reported year-over-year increases with the national rate at 0.5 per cent. Prince Edward Island (+0.9%) and Quebec (+0.7%) reported the largest price level increases, while Nova Scotia (+0.2%), Manitoba (+0.2%) and British Columbia (+0.2%) reported the smallest increases.
Compared to the previous month, the CPI excluding food and energy is down in six of ten provinces, with Manitoba, Saskatchewan and Alberta reporting the largest declines at 0.4 per cent.
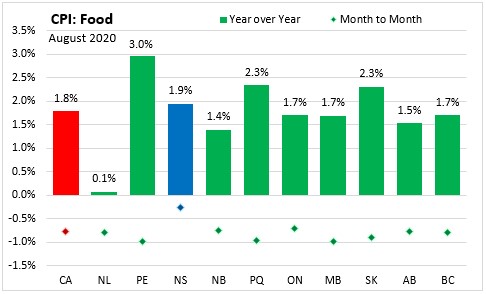
The CPI for food in Nova Scotia increased 1.9 per cent year-over-year in August. Food prices increased in all provinces, with the national average at 1.8 per cent. Prince Edward Island (+3.0%), Quebec (+2.3%) and Saskatchewan (+2.3%) had the largest percentage increases in food prices compared to August 2019. Food prices increased in Newfoundland and Labrador by only 0.1 per cent compared to a year ago.
On a monthly basis, all provinces experienced decreases in food prices, with Prince Edward Island, Quebec and Manitoba reporting the largest declines at 1.0 per cent.
In August, the Nova Scotia energy price index decreased 11.8 per cent compared to a year ago. Year-over-year, the energy price index decreased in every province, with a national average decline of 6.3 per cent. The largest annual decline was in Prince Edward Island (-13.7%). Alberta (-0.3%) had the smallest year-over-year decline.
Monthly energy prices (August 2020 vs. July 2020) were down in eight of ten provinces, with the largest decline in Alberta (-0.9%). Energy prices were up in Nova Scotia by 0.3 per cent compared to July.

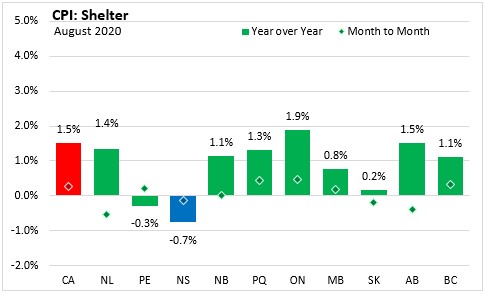
Year-over-year, Nova Scotia had the largest decline in the consumer price index for shelter in August, with a decline of 0.7 per cent. For all of Canada, the shelter price index increased 1.5 per cent, with the largest increase in Ontario (+1.9%).
Nova Scotia's consumer price inflation (year-over-year growth in CPI) excluding energy was 0.5 per cent in August, compared to a national rate of 0.7 per cent. The rate of increase in the CPI excluding energy index was similar across most provinces at around 0.5 per cent year-over-year, with the exceptions being Prince Edward Island (+1.2%), Quebec (+1.1%) and Newfoundland and Labrador (+0.1%).
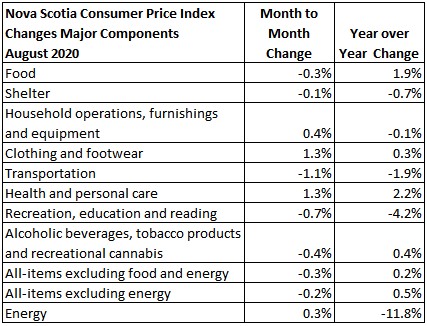
Major Components for August 2020
The following table shows the price increases specific to Nova Scotia for the major components of the CPI this month:
Long Run Trends
In August 2020, the All-Items CPI year-over-year inflation rate for Nova Scotia was -0.7 per cent, below Canada's at 0.1 per cent. Nova Scotia's annual inflation has mostly been below the Canadian average since mid-2014, with the exception of only a few months. While month-to-month movements in the indices can be different, over time they generally follow the same overall trend. Nova Scotia’s year-over-year CPI inflation is currently at levels not seen since 2009.
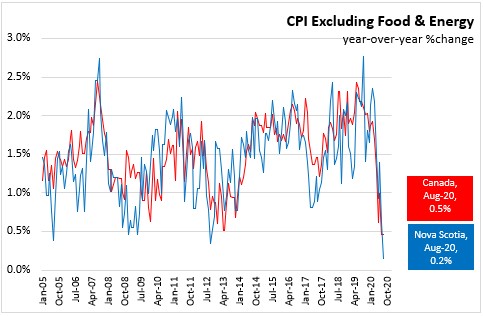
Annual inflation for the CPI excluding food and energy in Nova Scotia (+0.2%) was below than the national rate (+0.5%) in August 2020.
Bank of Canada's preferred measures of core inflation
Compared to August 2019, CPI-Common increased 1.5 per cent, CPI-Median rose 1.9 per cent and CPI-Trim was up 1.7 per cent in Canada. All-items CPI excluding eight of the most volatile components as defined by the Bank of Canada, and excluding the effect of changes in indirect taxes (formerly referred to as CPIX), rose 0.8 per cent, year-over-year.

Appendix Tables and Charts
Source: Statistics Canada data portal: Tables 18-10-0004-01 and 18-10-0256-01
<--- Return to Archive