The Economics and Statistics Division maintains archives of previous publications for accountability purposes, but makes no updates to keep these documents current with the latest data revisions from Statistics Canada. As a result, information in older documents may not be accurate. Please exercise caution when referring to older documents. For the latest information and historical data, please contact the individual listed to the right.
<--- Return to Archive
For additional information relating to this article, please contact:
October 06, 2020NOVA SCOTIA - INTERNATIONAL MERCHANDISE TRADE AUGUST 2020 Year-to-Date (Jan-Aug 2020 vs Jan-Aug 2019, customs based, seasonally adjusted)
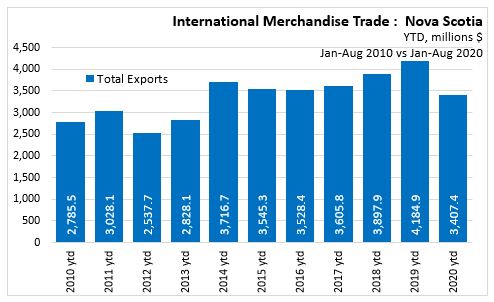
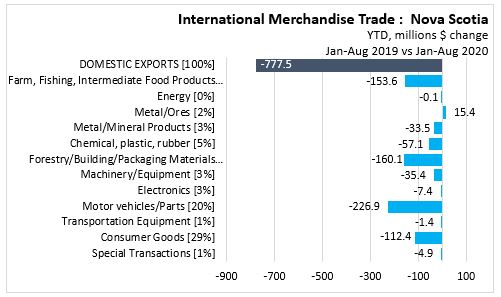
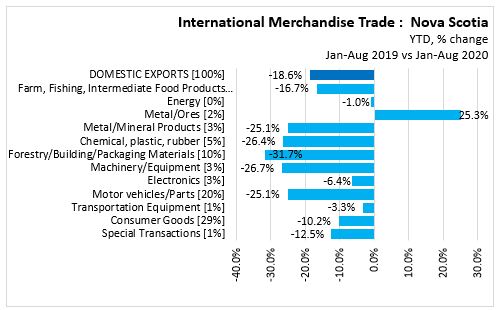
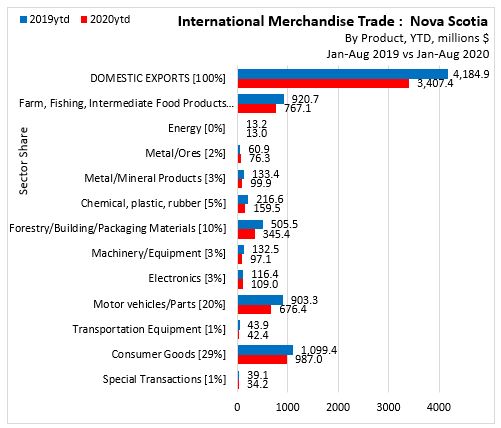
In Jan-Aug 2020 vs Jan-Aug 2019, Nova Scotia International Merchandise Trade Exports decreased 18.6% ($777.5 million) to $3,407.4 million.
The largest dollar value increase was in
- Metal/Ores ($15.4 million)
The largest declines were in
- Motor vehicles/Parts(-$226.9 million)
- Forestry/Building/Packaging Materials(-$160.1 million)
- Farm, Fishing, Intermediate Food Products(-$153.6 million)
- Consumer Goods(-$112.4 million)
- Chemical, plastic, rubber(-$57.1 million)
- Machinery/Equipment(-$35.4 million)
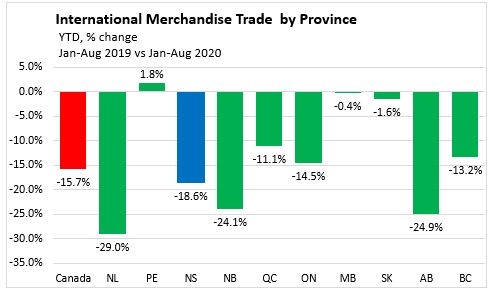
Year to date - By Province (Jan-Aug 2020)
Nova Scotia reported a 18.6% loss in merchandise trade exports. Canada reported a 15.7% loss in merchandise trade exports. Prince Edward Island reported the only increase (1.8%) while Newfoundland and Labrador reported the highest decline (29.0%).
TREND NS AND CANADA
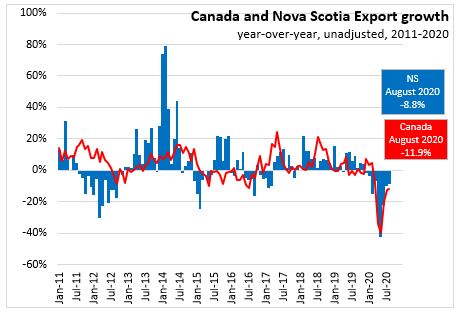
In August 2020 Nova Scotia reported a 10.5% year-over-year decline in merchandise trade exports. This compares to a -21.7% year-over-year decline in July 2020, and a -42.5% year-over-year decline in June 2020.
In August 2020 Canada reported a 12.5% year-over-year decline in merchandise trade exports. This compares to a -20.7% year-over-year decline in July 2020, and a -39.7% year-over-year decline in June 2020.
YEAR-TO-DATE EXPORTS BY INTERNATIONAL DESTINATION
Jan-Aug 2020 vs Jan-Aug 2019
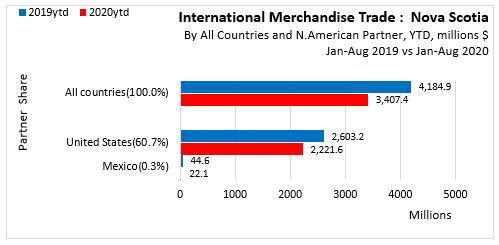
In North America, exports to
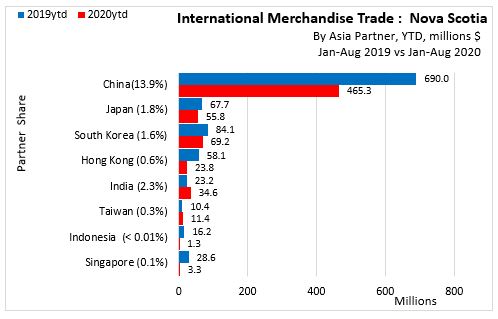
In Asia, exports to
- China decreased 32.6% (-$224.7 million)
- Japan decreased 17.5% (-$11.9 million)
- South Korea decreased 17.7% (-$14.9 million)
- Hong Kong decreased 59.1% (-$34.4 million)
- India increased 49.4% ($11.4 million)
- Taiwan increased 9.6% ($1.0 million)
- Indonesia decreased 91.9% (-$14.9 million)
- Singapore decreased 88.6% (-$25.3 million)
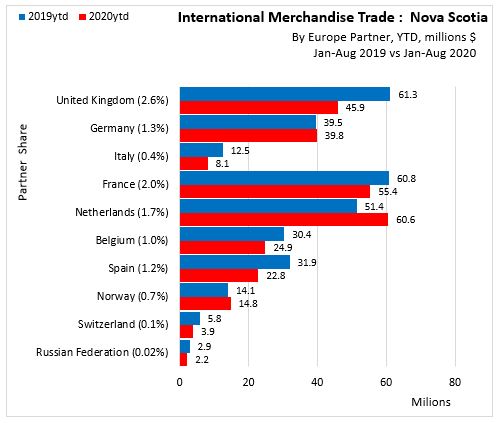
In Europe, exports to
- United Kingdom decreased 25.0% (-$15.3 million)
- Germany increased 0.9% ($0.3 million)
- Italy decreased 35.2% (-$4.4 million)
- France decreased 8.8% (-$5.4 million)
- Netherlands increased 17.8% ($9.2 million)
- Belgium decreased 18.1% (-$5.5 million)
- Spain decreased 28.5% (-$9.1 million)
- Norway increased 5.0% ($0.7 million)
- Switzerland decreased 33.2% (-$1.9 million)
- Russian Federation decreased 23.9% (-$0.7 million)
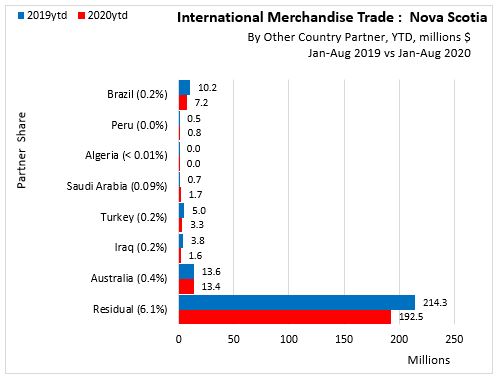
In other countries, exports to
- Brazil decreased 29.5% (-$3.0 million)
- Peru increased 67.7% ($0.3 million)
- Algeria increased 77.8% ($0.0 million)
- Saudi Arabia increased 127.2% ($0.9 million)
- Turkey decreased 35.1% (-$1.8 million)
- Iraq decreased 59.1% (-$2.3 million)
- Australia decreased 1.5% (-$0.2 million)
- Residual decreased 10.2% (-$21.9 million)
12-10-0119-01 International merchandise trade: Nova Scotia sectors
12-10-0119-01 International merchandise trade: by province and commodity
12-10-0119-01 International merchandise trade: by province and energy commodity
12-10-0119-01 International merchandise trade: by province, commodity, trading partners
Trading partners group 1: All, US, China
Trading partners group 2: Japan et al
Trading partners group 3: UK et al
Trading partners group 4: Mexico et al
<--- Return to Archive