The Economics and Statistics Division maintains archives of previous publications for accountability purposes, but makes no updates to keep these documents current with the latest data revisions from Statistics Canada. As a result, information in older documents may not be accurate. Please exercise caution when referring to older documents. For the latest information and historical data, please contact the individual listed to the right.
<--- Return to Archive
For additional information relating to this article, please contact:
October 23, 2020UNDERGROUND ECONOMY IN CANADA: 2018 A recent Statistics Canada report estimates the value of the underground economy as a percentage of gross domestic product. The underground economy is defined as “consisting of market-based activities, whether legal or illegal, that escape measurement because of their hidden, illegal or informal nature.”
In Nova Scotia, the underground economy is estimated to have amounted to 2.9% of provincial GDP in 2018, a total of $1.28 billion. Nova Scotia's underground economy as a share of GDP is higher than the national average (2.7% or $61.15 billion). Underground economy as a share of GDP is highest in British Columbia (3.7%) and lowest in Newfoundland and Labrador (1.7%) and Alberta (1.8%).

Over the last 5 years of data, Nova Scotia's underground economy rose and then fell as a share of GDP. These fluctuations in underground economy as a share of GDP have been more pronounced as a national level: a faster rise followed by a sharper decline.

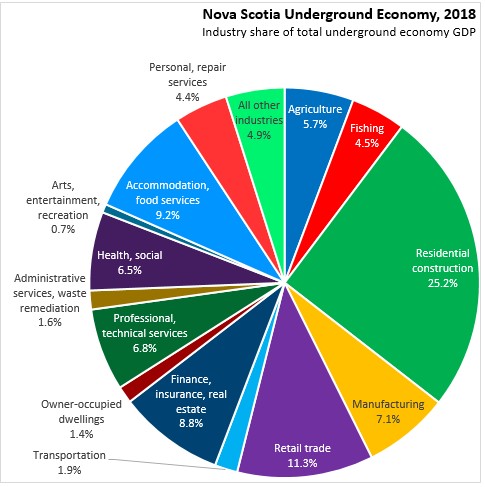
In Nova Scotia, residential construction accounts for over one-quarter of estimated underground economy GDP. The next six largest contributors to underground economy amount to about 50 per cent of Nova Scotia's underground economy: retail trade, accommodation/food services, finance/insurance/real estate, manufacturing, professional/technical services and health care/social assistance.
Notes: Statistics Canada has made changes to the methodology for measuring the underground economy in light of the recent legalization of cannabis:
In this study, some illegal activities, such as those related to drugs (except cannabis) and prostitution, have been excluded. It should be noted that unlicensed cannabis production and consumption was excluded from previous studies. However, following the legalization of recreational use of cannabis on October 17, 2018, the goods and services associated with licensed and unlicensed cannabis have been incorporated into the Canadian System of Macroeconomic Accounts. To align with this change, unlicensed cannabis production and consumption have been added to these estimates, dating back to 2014.
Further, Statistics Canada cautions that data on the underground economy are by definition unobserved and estimates are prepared using assumptions, indicative measures and indirect methods. The estimates presented represent an upper bound. Users should interpret the data carefully and should not add estimates of underground economy to conventionally-measured GDP.
Source: Statistics Canada (data tables available by request)
<--- Return to Archive