The Economics and Statistics Division maintains archives of previous publications for accountability purposes, but makes no updates to keep these documents current with the latest data revisions from Statistics Canada. As a result, information in older documents may not be accurate. Please exercise caution when referring to older documents. For the latest information and historical data, please contact the individual listed to the right.
<--- Return to Archive
For additional information relating to this article, please contact:
October 28, 2020CANADIAN HOUSING STATISTICS PROGRAM, 2019 Statistics Canada released new data today from the Canadian Housing Statistics Program (CHSP) which provide insight into the household characteristics of property owners in Nova Scoria, Ontario, and British Columbia. Today’s release included revised data on housing for the 2018 reference year and expanded coverage from the provincial level to municipal levels in these provinces.
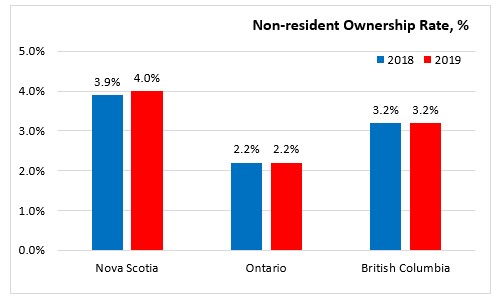
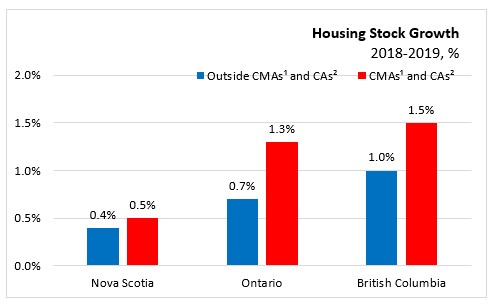
Taxes were introduced in parts of Ontario and British Columbia on properties purchased by foreign buyers from 2016 and 2018. New data for 2019 shows that the share of residential properties owned by non-residents remained stable in those two provinces from 2018 to 2019, though it did change in certain segments of the housing market. The housing stock in Ontario and British Columbia grew at a faster pace in regions outside the core of major census metropolitan areas (CMAs). It also posted stronger growth in urban areas than in rural areas in both provinces, as well as in Nova Scotia.
The housing stock in all three provinces grew at a faster pace in urban centres—defined here as CMAs and census agglomerations (CAs)—than in rural areas. This trend was also seen in the population estimates published by Statistics Canada's Centre for Demography, which indicated that population growth in CMAs and CAs was higher than in other regions.
In Nova Scotia, regions outside the Halifax CMA continued to post the highest proportion of properties owned by non-residents in 2019 (4.6%). The non-resident ownership rate of single-detached houses outside Halifax (3.7%) was almost twice the rate as in the Halifax CMA (1.9%).
In Nova Scotia, the housing stock increased 0.5 per cent from 2018 to 2019 in CMAs and CAs compared to the 0.4 per cent growth rate observed in rural areas.
1- Census Metropolitan Areas (CMAs)
2 - Census Agglomerations (CAs)
Source: Statistics Canada, Canada Housing Statistics Program, 2019
<--- Return to Archive