The Economics and Statistics Division maintains archives of previous publications for accountability purposes, but makes no updates to keep these documents current with the latest data revisions from Statistics Canada. As a result, information in older documents may not be accurate. Please exercise caution when referring to older documents. For the latest information and historical data, please contact the individual listed to the right.
<--- Return to Archive
For additional information relating to this article, please contact:
November 06, 2020LABOUR FORCE SURVEY: VISIBLE MINORITIES, OCTOBER 2020 Starting with July 2020, Statistics Canada has added a question to the Labour Force Survey asking respondents about whether they identify with visible minority populations. The population group categories of response are the same as those found in the 2016 Census: White, South Asian (e.g., East Indian, Pakistani, Sri Lankan), Chinese, Black, Filipino, Arab, Latin American, Southeast Asian (e.g., Vietnamese, Cambodian, Laotian, Thai), West Asian (e.g., Iranian, Afghan), Korean, Other.
Labour force characteristics for Aboriginal populations are reported separately in the Labour Force Survey.
This analysis will focus on conditions reported by respondents for October 2020. Results are not seasonally adjusted. Unless otherwise indicated, data refer to populations aged 15-69.
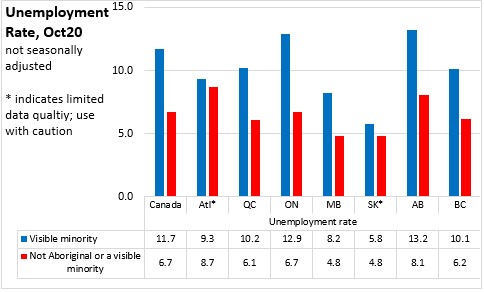
The results for October 2020 continue to show that respondents who identify with a visible minority population have higher unemployment rates (11.7 %) than those who do not identify as Aboriginal or a visible minority (6.7%). The unemployment rate for those who identify with a visible minority is unchanged from last month while the unemployment rate for those who do not identify as Aboriginal or a visible minority is down.
The gap in unemployment rates is notably larger in Quebec, Ontario, Alberta, British Columbia and Manitoba. In Atlantic Canada and Saskatchewan, populations that identify with a visible minority have unemployment rates that are closer to the unemployment rates of those that do not identify as Aboriginal or a visible minority (though this data is of limited quality).
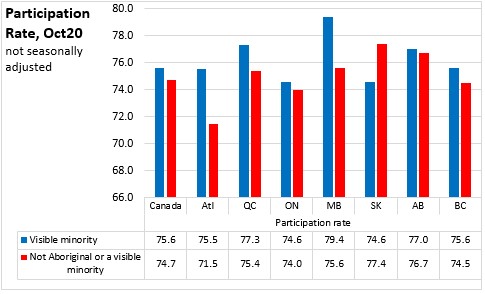
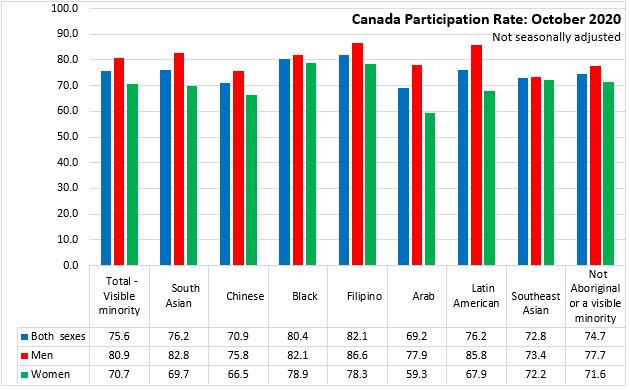
For the country as a whole, participation rates in the labour force are similar for visible minority populations as for those who do not identify as Aboriginal or visible minority. However, there is a notably higher participation rate for visible minorities in Quebec, Manitoba and Atlantic Canada.
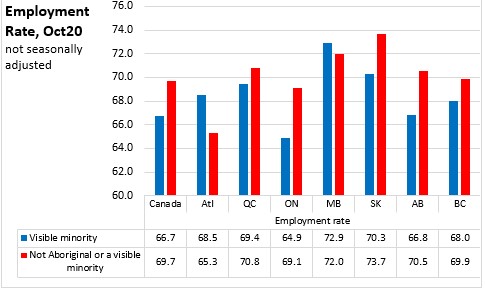
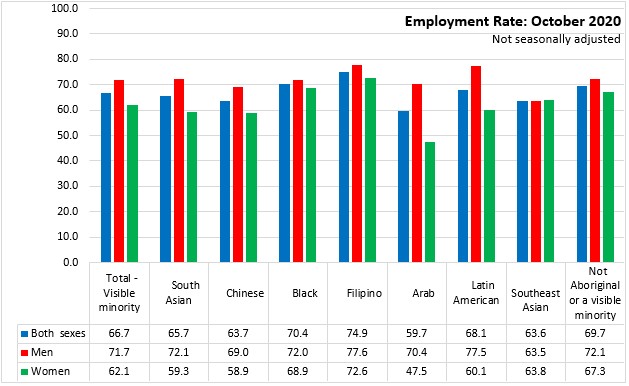
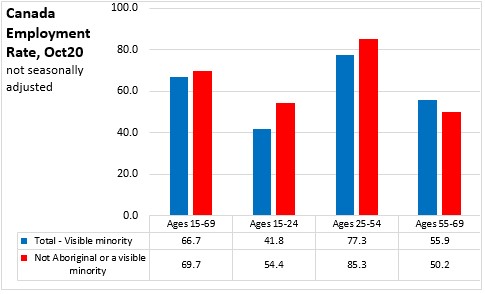
With similar participation rates and higher unemployment rates, there is a gap between employment rates of visible minorities (66.7%) and those who do not identify as aboriginal or a visible minority (69.7%). The largest gaps are observed in Ontario, Saskatchewan, Alberta and British Columbia. The gaps are smaller in Quebec and British Columbia. Employment rates are higher for visible minority populations in Atlantic Canada compared with those who do not identify as aboriginal or a visible minority.
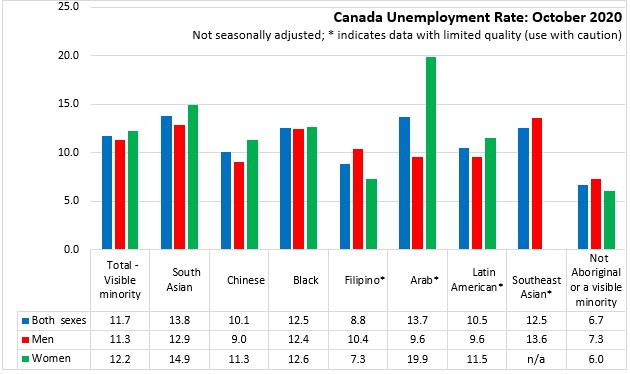
Unemployment rates were higher across all visible minority categories than for those who did not identify as Aboriginal or in a visible minority population. There were higher unemployment rates for women in South Asian and Arab populations. (Some of these results have limited data quality and should be used with caution).
Labour force participation rates are higher among men than women across all population groups. The difference somewhat wider among some visible minority populations.
With gaps in both participation and unemployment rates, women in many visible minority populations have notably lower employment rates than men. The gap between male and female employment rates is narrower among Filipino and Black populations. Women who are not in Aboriginal or visible minority populations also have lower employment rates than males.
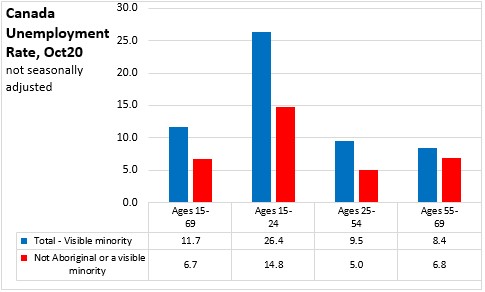
Unemployment rates are higher for all age cohorts of visible minority populations, but the gap is particularly large for youth.
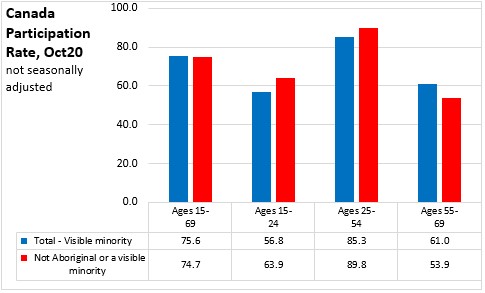
Participation rates of visible minority populations are higher for older workers, compared to the same age cohort that does not identify as Aboriginal or visible minority populations. Among youth and core aged workers, participation rates among visible minority populations are lower than among similarly-aged populations that do not identify as aboriginal or a visible minority.
With lower participation and higher unemployment rates, the gap in employment rates for visible minority youth populations is particularly wide. With stronger participation rates (and despite higher unemployment rates), the employment rate of older visible minority populations is higher than among older Canadians who do not identify as Aboriginal or a visible minority.
Source: Statistics Canada, Labour Force Survey, October 2020
<--- Return to Archive