The Economics and Statistics Division maintains archives of previous publications for accountability purposes, but makes no updates to keep these documents current with the latest data revisions from Statistics Canada. As a result, information in older documents may not be accurate. Please exercise caution when referring to older documents. For the latest information and historical data, please contact the individual listed to the right.
<--- Return to Archive
For additional information relating to this article, please contact:
February 05, 2021NOVA SCOTIA - INTERNATIONAL MERCHANDISE TRADE DECEMBER AND ANNUAL 2020

ANNUAL - By Sector (2000 to 2020)
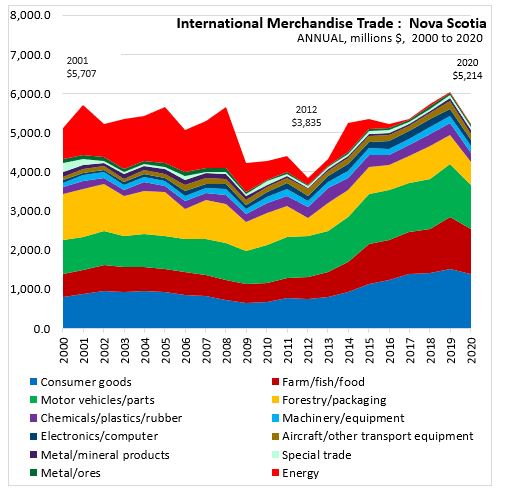
In 2020, Nova Scotia exports contracted to $5.2 billion. Exports have been expanding in most years since 2012. During the period from 2000 to 2008 energy products were a significant contributor to total exports. In the period 2008 to 2012 export growth was in decline. Since 2008, energy exports have declined to near zero levels, but other commodities have increased to fill the gap.
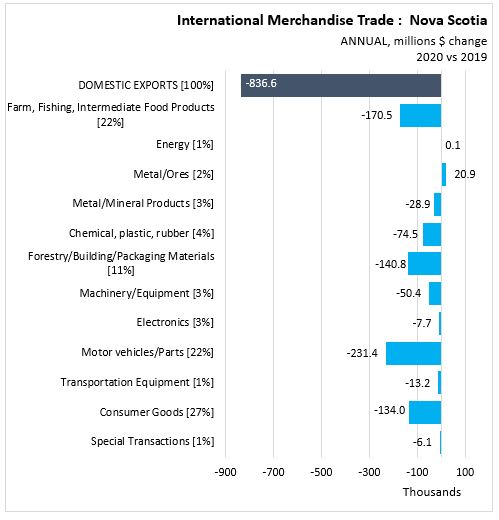
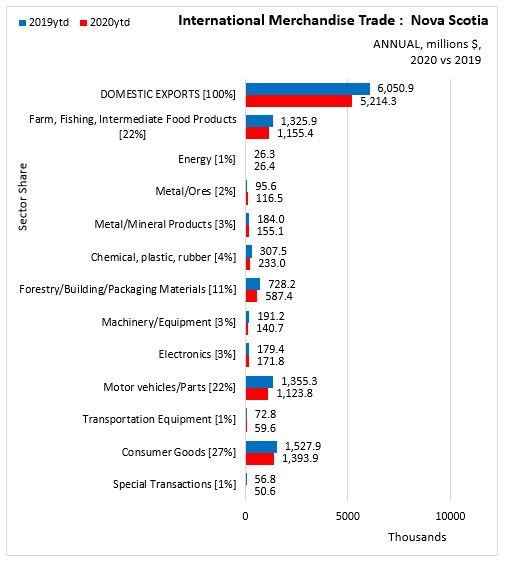
ANNUAL (2020 vs 2019, customs based, unadjusted)
In Nova Scotia International Merchandise Trade Exports decreased 13.8% (-$836.6 million) to $5.2 billion. Two sectors reported positive growth. The largest dollar value increase was in
- Metal/Ores( $20.9 million)
- Energy ($0.1 million)
All other sectors reported negative growth. The largest declines were in
- Motor vehicles/Parts (-$231.4 million)
- Farm, Fishing, Intermediate Food Products (-$170.5 million)
- Forestry/Building/Packaging Materials (-$140.8 million)
- Consumer Goods (-$134.0 and million)
- Chemical, plastic, rubber (-$74.5 million)
- Machinery/Equipment (-$50.4 million)
- Metal/Mineral Products (-$28.9 million)
- Transportation Equipment (-$13.2 million)
- Electronics (-$7.7 million) and
- Special Transactions (-$6.1 million)

Annual By Province (2020 vs 2019)
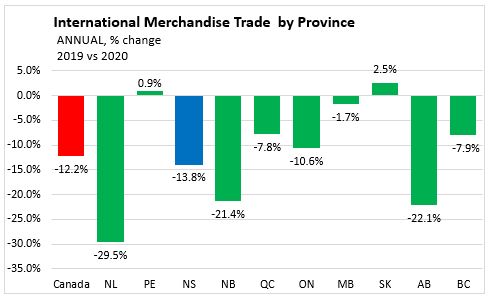
- Nova Scotia reported a 13.8% decline in merchandise trade exports.
- Canada reported a 12.2% decline in merchandise trade exports.
- Saskatchewan reported the highest increase (2.5%) while,
- Newfoundland and Labrador reported the highest decline (-29.5%) in merchandise trade exports.
TREND NOVA SCOTIA AND CANADA
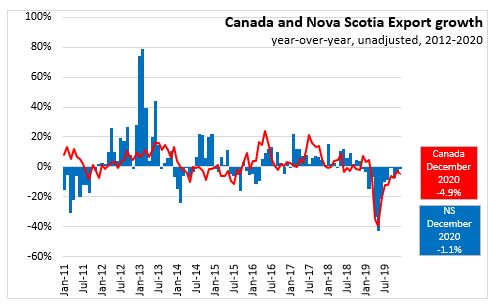
In Dec 2020, Nova Scotia International Merchandise Trade Exports reported a 1.1% decline in merchandise trade exports. This compares to a 1.4% decline in merchandise trade exports in Dec 2019 and a 1.1% increase in merchandise trade exports in Dec 2018.
In Dec 2020, Canada International Merchandise Trade Exports reported a 4.9% decline in merchandise trade exports. This compares to a 7.2% increase in merchandise trade exports in Dec 2019 and a 0.9% increase in merchandise trade exports in Dec 2018.
ANNUAL EXPORTS BY INTERNATIONAL DESTINATION (2020 vs 2019)

In North America exports to
- United States decreased 10.4% (-$392.8 million)
- Mexico decreased 20.3% (-$12.9 million)
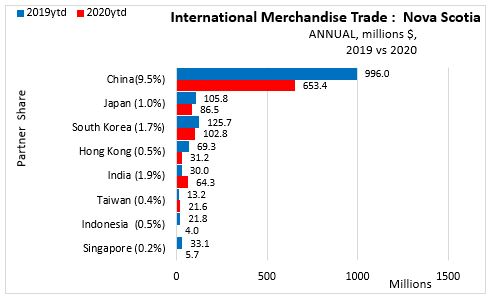
In Asia exports to
- China decreased 34.4% (-$342.5 million)
- Japan decreased 18.2% (-$19.3 million)
- South Korea decreased 18.3% (-$23.0 million)
- Hong Kong decreased 55.0% (-$38.2 million)
- India increased 114.4% ($34.3 million)
- Taiwan increased 64.0% ($8.4 million)
- Indonesia decreased 81.4% (-$17.7 million)
- Singapore decreased 82.9% (-$27.5 million)
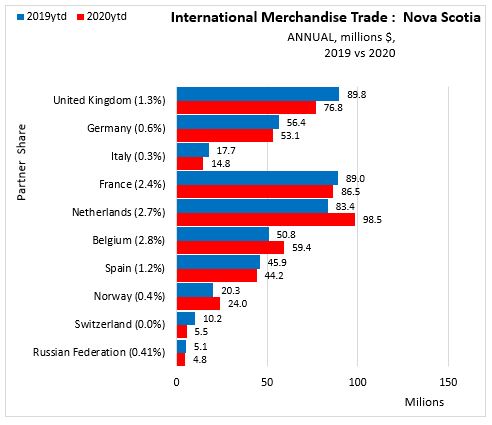
In Europe, exports to
- United Kingdom decreased 14.4% (-$13.0 million)
- Germany decreased 5.9% (-$3.3 million)
- Italy decreased 16.4% (-$2.9 million)
- France decreased 2.9% (-$2.6 million)
- Netherlands increased 18.0% ($15.0 million)
- Belgium increased 16.9% ($8.6 million)
- Spain decreased 3.8% (-$1.7 million)
- Norway increased 18.5% ($3.7 million)
- Switzerland decreased 45.8% (-$4.7 million)
- Russian Federation decreased 7.4% (-$0.4 million)
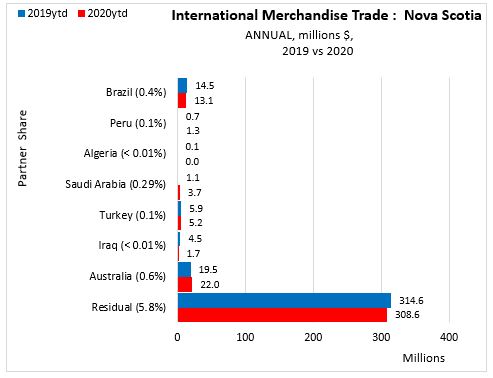
In other countries, exports to
- Brazil decreased 9.7% (-$1.4 million)
- Peru increased 75.0% ($0.5 million)
- Algeria decreased 45.8% (-$0.03 million)
- Saudi Arabia increased 230.4% ($2.5 million)
- Turkey decreased 10.9% (-$0.6 million)
- Iraq decreased 62.2% (-$2.8 million)
- Australia increased 12.9% ($2.5 million)
- Residual decreased 1.9% (-$6.0 million)
12-10-0119-01 International merchandise trade: Nova Scotia sectors
12-10-0119-01 International merchandise trade: by province and commodity
12-10-0119-01 International merchandise trade: by province and energy commodity
12-10-0119-01 International merchandise trade: by province, commodity, trading partners
Trading partners group 1: All, US, China
Trading partners group 2: Japan et al
Trading partners group 3: UK et al
Trading partners group 4: Mexico et al
<--- Return to Archive