The Economics and Statistics Division maintains archives of previous publications for accountability purposes, but makes no updates to keep these documents current with the latest data revisions from Statistics Canada. As a result, information in older documents may not be accurate. Please exercise caution when referring to older documents. For the latest information and historical data, please contact the individual listed to the right.
<--- Return to Archive
For additional information relating to this article, please contact:
March 16, 2021US RETAIL SALES, FEBRUARY 2021 Month over month (February 2021, seasonally adjusted)
The US Census Bureau announced today that the advance estimates of U.S retail and food service sales decreased 3.0% ($17.4 billion) to $561.7 billion. Excluding food services and drinking places, retail trade sales decreased 3.1% ($16.1 billion). Food service and drinking place month-over-month receipts decreased 2.5% ($1.4 billion).
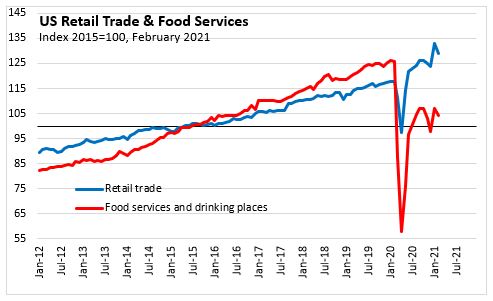
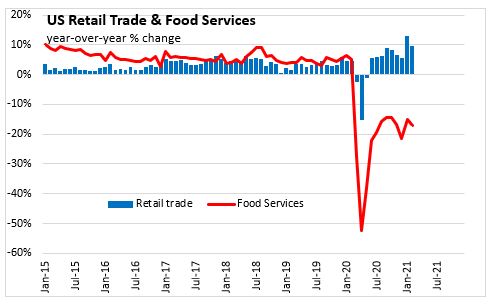
Year-over-year (Feb-21 vs Feb-20, seasonally adjusted)
The United States Retail Trade and Food Services increased 6.3% ($33.1 billion). Retail trade increased 9.5% ($44.2 billion), food services and drinking places sales decreased 17.0% ($11.1 billion)
SECTOR ANALYSIS
Year-to-date (Jan-Feb 2021 vs Jan-Feb 2020, seasonally adjusted)
The United States Retail Trade and Food Services increased 7.9% ($83.4 billion) to $1,140.8 billion. Retail trade increased 11.3% ($104.4 billion), food services and drinking places sales decreased 16.1% ($21.0 billion). Sales were up in 9 of 13 retail categories, the fastest gains (in percentage terms) being reported in non-store retailers (30.0%). The largest declines (in percentage terms) were seen in food services (-16.1%).
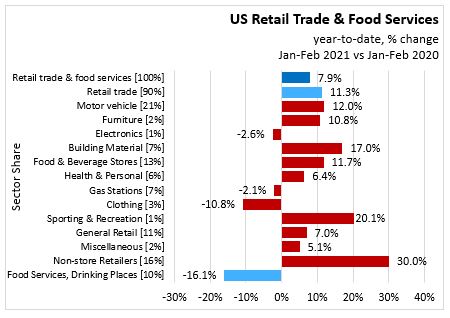
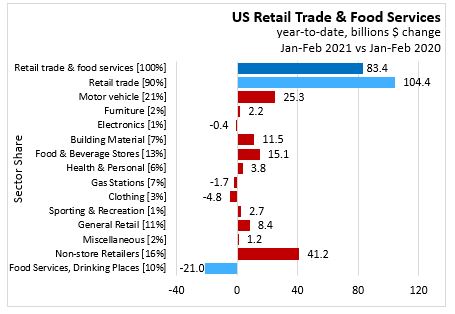
Sectors that increased:
- Motor vehicle dealers increased 12.0% ($25.3 billion).
- Furniture stores increased 10.8% ($2.2 billion).
- Building materials stores increased 17.0% ($11.5 billion).
- Food and beverage stores increased 11.7% ($15.1 billion).
- Heath and personal care stores increased 6.4% ($3.8 billion).
- Sports and hobby stores increased 20.1% ($2.7 billion).
- General merchandise stores increased 7.0% ($8.4 billion).
Sectors that decreased:
- Electronics stores decreased 2.6% ($0.4 billion).
- Gasoline Stations decreased 2.1% ($1.7 billion).
- Clothing stores decreased 10.8% ($4.8 billion).
REFERENCE
US Census Bureau. retrieved from FRED, Federal Reserve Bank of St. Louis;
Tables: RSCCAS Advance Retail Sales: Clothing and Clothing Accessory Stores
RSAFS Advance Retail Sales: Retail and Food Services, Total
RSXFS Advance Retail Sales: Retail (Excluding Food Services)
RSMVPD Advance Retail Sales: Motor Vehicle and Parts Dealers
RSFHFS Advance Retail Sales: Furniture and Home Furnishings Stores
RSEAS Advance Retail Sales: Electronics and Appliance Stores
RSBMGESD Advance Retail Sales: Building Materials, Garden Equipment and Supplies Dealers
RSDBS Advance Retail Sales: Food and Beverage Stores
RSHPCS Advance Retail Sales: Health and Personal Care Stores
RSGASS Advance Retail Sales: Gasoline Stations
RSSGHBMS Advance Retail Sales: Sporting Goods, Hobby, Book, and Music Stores
RSGMS Advance Retail Sales: General Merchandise Stores
RSMSR Advance Retail Sales: Miscellaneous Store Retailers
RSNSR Advance Retail Sales: Nonstore Retailers
RSFSDP Advance Retail Sales: Food Services and Drinking Places
<--- Return to Archive