The Economics and Statistics Division maintains archives of previous publications for accountability purposes, but makes no updates to keep these documents current with the latest data revisions from Statistics Canada. As a result, information in older documents may not be accurate. Please exercise caution when referring to older documents. For the latest information and historical data, please contact the individual listed to the right.
<--- Return to Archive
For additional information relating to this article, please contact:
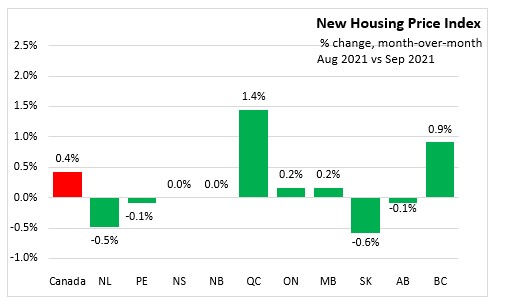
October 21, 2021NEW HOUSING PRICE INDEX, SEPTEMBER 2021 Month-over-month (Sep 2021 vs Aug 2021)
In Nova Scotia, the price of new housing remained unchanged from the previous month. Nationally, prices were up 0.4%. New home prices declined in five Census Metropolitan Areas (CMAs) which was the largest number of CMAs reporting price decline since March 2020. New home prices increased in 13 of the CMAs and remained unchanged in the remaining CMAs.
The largest month-over-month increase was in Quebec (+1.4%) while prices declined in Saskatchewan (-0.6%), Newfoundland and Labrador (-0.5%) and Alberta (-0.1%) and Prince Edward Island (-0.1%).
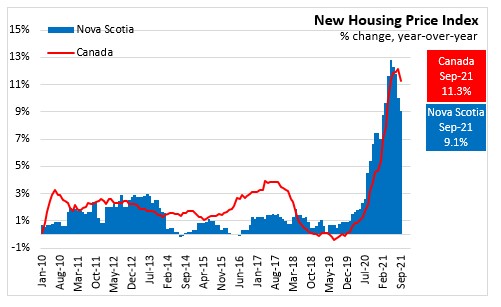
Year-over-year (Sep 2021 vs Sep 2020)
Nova Scotia’s new housing prices increased 9.1% from the previous year in September. Nationally, prices were up 11.3%. All provinces posted gains led by Quebec (+18.3%).
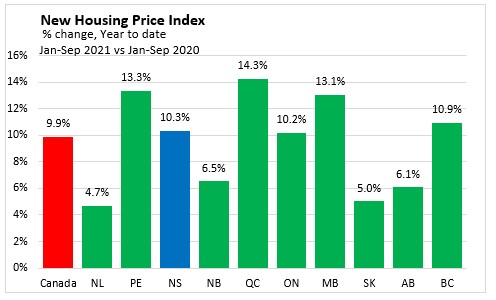
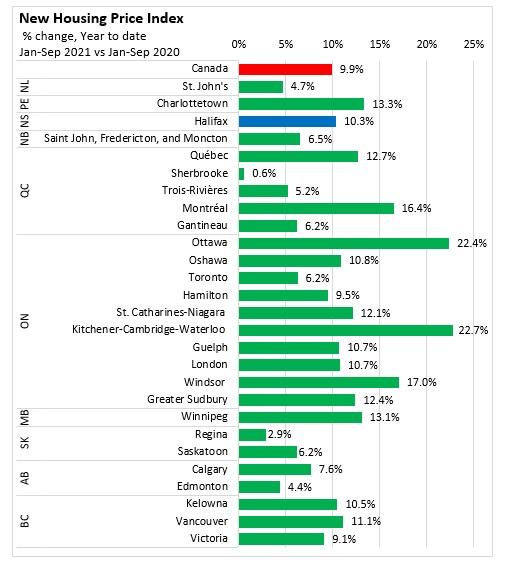
Year-to-date (Jan-Sep 2021 vs Jan-Sep 2020)
Nova Scotia’s new housing prices were up 10.3%, above the national average of 9.9% during the first nine months of 2021. Quebec (+14.3%) saw the fastest growth while Newfoundland and Labrador (+4.7%) reported the smallest increase from the same period last year.
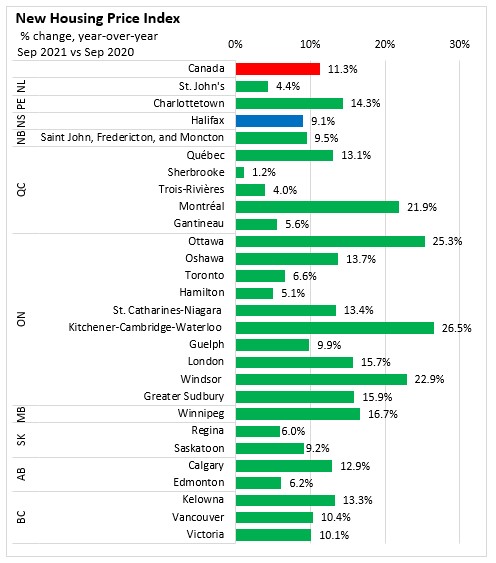
Census Metropolitan Areas
Year-over-Year (Sep 2021 vs Sep 2020)
New house price growth among Census Metropolitan Areas was fastest in Kitchener-Cambridge-Waterloo (+26.5%) and Ottawa (+25.3%). The slowest growth was in Sherbrooke (+1.2%). Nova Scotia's CMA, Halifax, reported a 9.1% increase.
Year-to-date (Jan-Sep 2021 vs Jan-Sep 2020)
In Halifax, new housing prices increased 10.3% in the first nine months of 2021 when compared to same period last year. New house price growth among Census Metropolitan Areas was fastest in Kitchener-Cambridge-Waterloo (+22.7%) and Ottawa (+22.4%). The slowest growth was in Sherbrooke (+0.6%) and Regina (+2.9%).
Source: Statistics Canada. Table 18-10-0205-01 New housing price index, monthly
<--- Return to Archive