The Economics and Statistics Division maintains archives of previous publications for accountability purposes, but makes no updates to keep these documents current with the latest data revisions from Statistics Canada. As a result, information in older documents may not be accurate. Please exercise caution when referring to older documents. For the latest information and historical data, please contact the individual listed to the right.
<--- Return to Archive
For additional information relating to this article, please contact:
January 26, 2022FOOD SERVICES AND DRINKING PLACES, NOVEMBER 2021 With November reference month results, year-over-year (Nov 2021 vs. Nov 2020) and year-to-date (Jan-Nov 2021 vs. Jan-Nov 2020) show rebounds in economic activity from the unprecedented declines observed in the first wave of the COVID-19 pandemic.
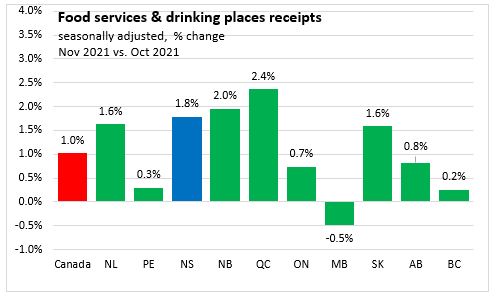
Month-over-Month (Nov 2021 vs. Oct 2021, seasonally adjusted)
Nova Scotia food services and drinking places receipts increased 1.8% to $153.0 million. Canada's food services and drinking places receipts increased 1.0% to $6.4 billion. Nine provinces reported monthly increases in food services and drinking places, with Quebec (2.4%) reporting the largest gain, and Manitoba (-0.5%) reporting the only decline in percentage terms.
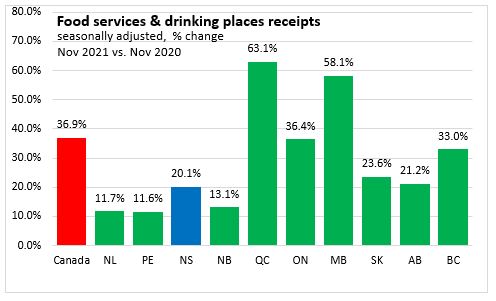
Year-over-Year (Nov 2021 vs. Nov 2020, seasonally adjusted)
Nova Scotia food services and drinking places receipts increased 20.1%. Canada's food services and drinking places receipts increased 36.9%. All provinces reported year-over-year increases in food services and drinking place receipts, with Quebec (63.1%) reporting the largest gain and Prince Edward Island (11.6%) reporting the smallest gain in percentage terms.
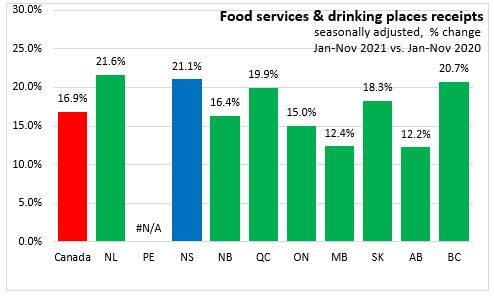
Year-to-Date (Jan-Nov 2021 vs. Jan-Nov 2020, seasonally adjusted)
Nova Scotia food services and drinking places receipts increased 21.1% ($260.3 million). Canada's food services and drinking places receipts increased 16.9% ($8.6 billion).
Nine provinces reported year-to-date increases in food services and drinking place receipts, with Newfoundland and Labrador (21.6%) reporting the largest gain and Alberta (12.2%) reporting the smallest gain in percentage terms.
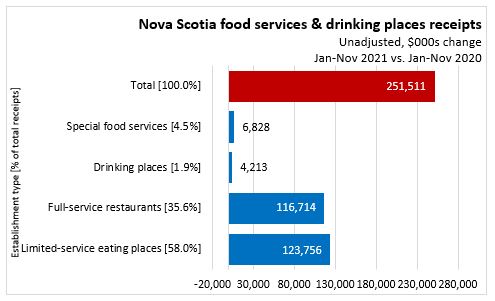
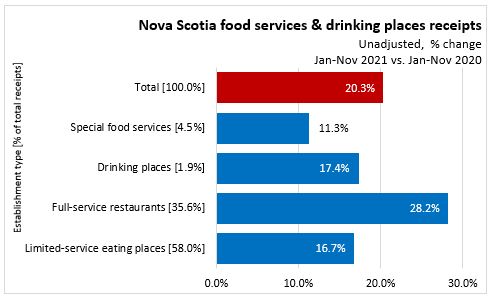
Nova Scotia Sales by Establishment Type (Jan-Nov 2021 vs. Jan-Nov 2020, unadjusted)
Compared with Jan-Nov 2020, the gains in food service and drinking place receipts have been most pronounced for Nova Scotia's limited-services eating places services restaurants ($123.8 million) and full-services restaurants ($116.7 million). In year-to-date percentage terms, the increases have been greater for full-service restaurants (+28.2%) and drinking places (+17.4%) with a smaller increase for special food services (+11.3%) and limited-service eating places (+16.7%).
Trends
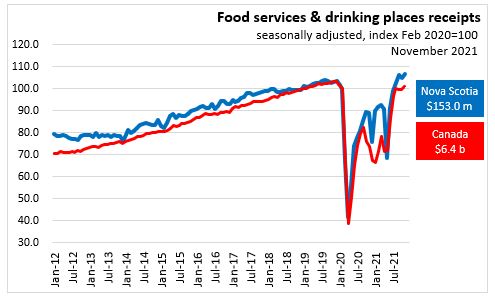
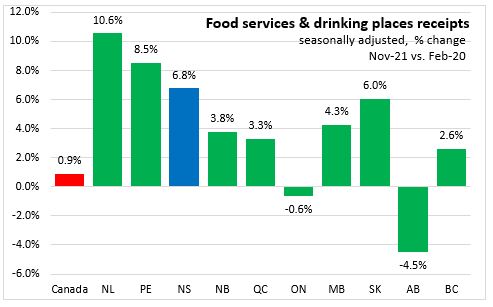
Nova Scotia's Food services and drinking places month over month sales declined sharply in March 2020 (-32.4%) and April 2020 (-38.2%). Recovery began with rapid gains in May 2020 (+32.2%) and June 2020 (+34.3%). Nova Scotia experienced a short reversal in Nov-Dec 2020 but began a quick recovery in January (+18.0%) and February 2021 (+2.1%). Compared to February 2020 food services and drinking places sales in November 2021 are +6.8% above their pre-pandemic levels.
After five consecutive monthly gains, national food services and drinking places sales declined 7.8% to $4.8 billion in October 2020. This decline was mostly due to the second wave of COVID-19 restrictions introduced in several provinces. By February 2021 recovery had begun. National food services and drinking places sales are only 0.9% above their pre-pandemic levels. In November 2021, eight provinces report they are above February levels, and two provinces are below February 2020 levels.
Source: Statistics Canada. Table 21-10-0019-01 Monthly survey of food services and drinking places (x 1,000)
<--- Return to Archive