The Economics and Statistics Division maintains archives of previous publications for accountability purposes, but makes no updates to keep these documents current with the latest data revisions from Statistics Canada. As a result, information in older documents may not be accurate. Please exercise caution when referring to older documents. For the latest information and historical data, please contact the individual listed to the right.
<--- Return to Archive
For additional information relating to this article, please contact:
January 28, 2022HOUSEHOLD WEALTH, Q3 2021 As part of its new quarterly data for Distribution of Household Economic Accounts, Statistics Canada is now providing quarterly data on household wealth. This information is available for provinces as well as for income quintiles and age groups. These concepts align with the Provincial and Territorial Economic Accounts, but they remain subject to revision in future releases.
Household Assets, Liabilities and Net Worth
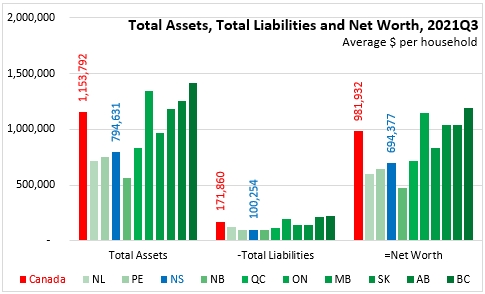
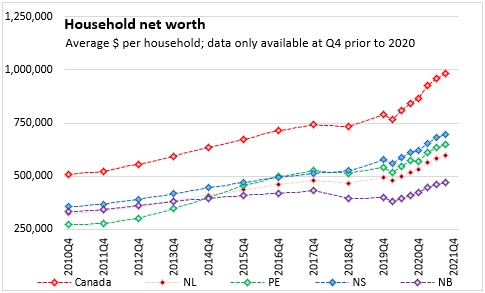
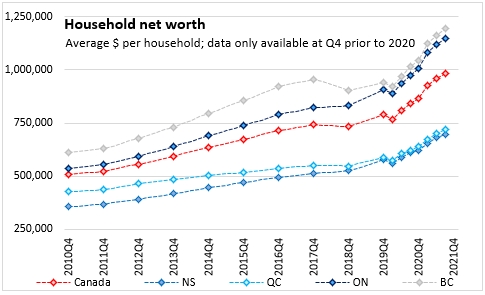
In the third quarter of 2021, Nova Scotia's net worth (excess of total assets above total financial liabilities) per household rose to over $694,377. This was below the national average net worth ($981,932 per household). Net worth was highest in British Columbia and Ontario. New Brunswick reports the lowest household net worth.
The average household value of assets in Nova Scotia was $794,631, which was below the national household average of $1,153,792. Ontario and British Columbia report the highest total asset values. Nova Scotia's financial liabilities amounted to $100,254 per household, below the national average of $171,860. Liabilities were highest in Alberta, British Columbia and Ontario and lowest in the Maritimes.
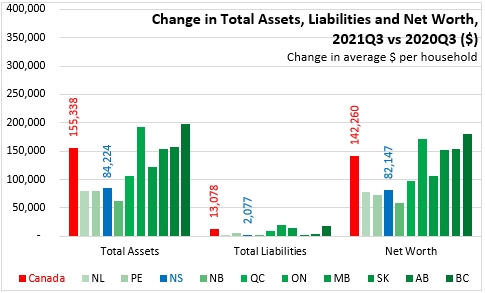
Compared to the same quarter in 2020, the average value of Nova Scotia household assets increased by $84,224 (11.9%). National average asset values grew $155,338 over this period (+15.6%) with faster growth in Ontario and British Columbia. New Brunswick reported the slowest growth in assets.
Nova Scotia's average household liabilities increased by just $2,077 (+2.1%) in this period while national average household liabilities were up $13,078 (+8.2%). Growth in liabilities was fastest in Ontario and British Columbia and slowest in Newfoundland and Labrador as well as Alberta.
Average household net worth increased by $82,147 (+13.4%) from 2020 Q3 to 2021 Q3 in Nova Scotia. National net worth increased by $142,260 (+16.9%) with the fastest growth in Ontario and British Columbia and the slowest growth in New Brunswick.
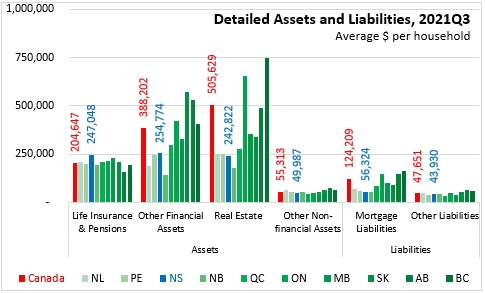
In detailed assets and liabilities by category, Nova Scotians reported the highest average household value of life insurance and pension assets ($247,048) compared with all other provinces in 2021 Q3. Other financial assets amounted to $254,774 per Nova Scotia household while real estate assets were worth $242,822 per household and other non-financial assets had a value of $49,987 per household. Against these assets, Nova Scotia's average household had mortgage liabilities of $56,324 and other liabilities of $43,930.
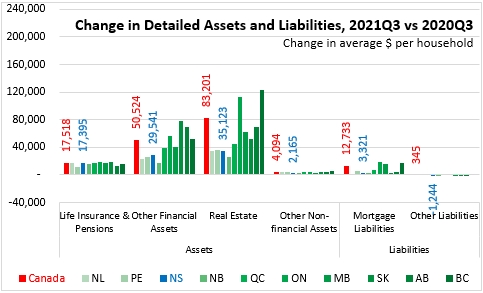
In the last four quarters, Nova Scotians' average household real estate assets increased in value by $35,123. Life insurance and pension assets values were up by $17,395 per household while other financial assets increased by $29,541 per household. Other non-financial assets increased by just $2,165 per household. Mortgage liabilities increased by $3,321 per household while other liabilities contracted by $1,244 per household.
Over time, Nova Scotia's average household net worth has increased from $357,173 in 2010 Q4 to a pre-pandemic level of $579,352 in 2019 Q4. Although net worth contracted in every province at the beginning of the pandemic in 2020 Q1, every province except New Brunswick recovered by the next quarter (and New Brunswick net worth recovered in the subsequent quarter). Several provinces reported declining net worth from 2017 Q4 to 2018 Q4; only Nova Scotia, Saskatchewan and Manitoba reported increases over this time.

Source: Statistics Canada. Table 36-10-0661-01 Distributions of household economic accounts, wealth, Canada, regions and provinces, quarterly (x 1,000,000)
<--- Return to Archive