The Economics and Statistics Division maintains archives of previous publications for accountability purposes, but makes no updates to keep these documents current with the latest data revisions from Statistics Canada. As a result, information in older documents may not be accurate. Please exercise caution when referring to older documents. For the latest information and historical data, please contact the individual listed to the right.
<--- Return to Archive
For additional information relating to this article, please contact:
March 21, 2022STUDY: ESTIMIATING THE ECONOMIC VALUE OF UNPAID HOUSEHOLD WORK IN CANADA, 2015 TO 2019 Statistics Canada recently released a study examining the economic value of unpaid household work in Canada, 2015 to 2019. The study uses time use survey data from the 2015 General Social Survey and wage data from Labour Force Survey. This article provides a summary of the findings of the study.
The concept of unpaid household work in the study includes services produced for own final use (it distinguishes between services that individuals perform for themselves or other members of their household, and those performed through volunteer work) and the third party criterion. The third party criterion is explained as: “those economic services produced in the household and outside the market, but which could be produced by a third person hired on the market without changing their utility to the members of the household” (Hawrylyshyn, 1978). Opportunity cost and replacement cost are used to estimate the economic value of unpaid household work. The study assumed that the hours of unpaid household work is unchanged from 2015 and updates the estimates of the value of unpaid household work for 2015-2019.
The opportunity cost assumes that when an individual performs unpaid household activities, they are forgoing other activities along with all of the associated monetary and non-monetary benefits. The study assumes that individuals only forgo monetary benefits to perform unpaid activities. Gross opportunity cost is before tax and net opportunity cost is after tax and are based on annual average wage rates by sex, age group and province of residence.
The replacement cost reflects the value of unpaid household activities which could be performed in the market by hiring someone to complete these activities. The value of these is based on average wage of a group of occupation that would perform similar tasks as the household activity.
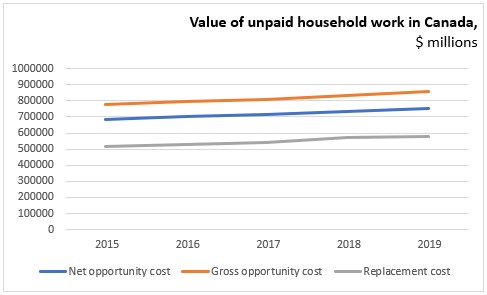
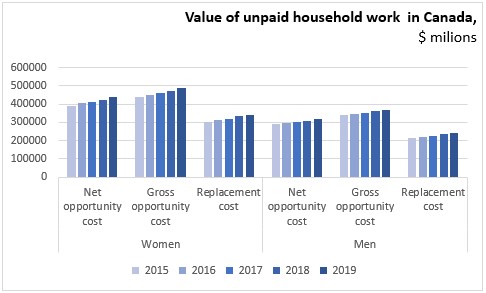
The value of unpaid household work based on gross opportunity cost increased to $860.2 billion and net opportunity cost increased to $754.9 billion in 2019. The value of unpaid household work based on replacement cost increased to $581.6 billion.
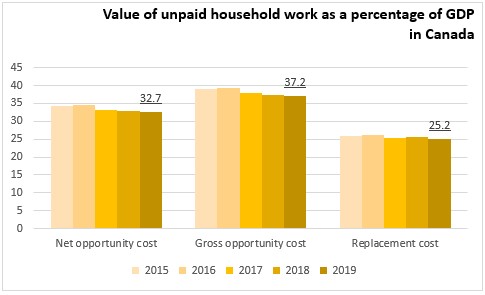
The value of unpaid household work as a percentage of GDP based on gross opportunity cost decreased to 37.2% in 2019 from 39.1% in 2015 and net opportunity cost decreased to 32.7% in 2019 from 34.3% in 2015. The value of unpaid household work based on replacement cost decreased to 25.2% in 2019 from 26.0% in 2015.
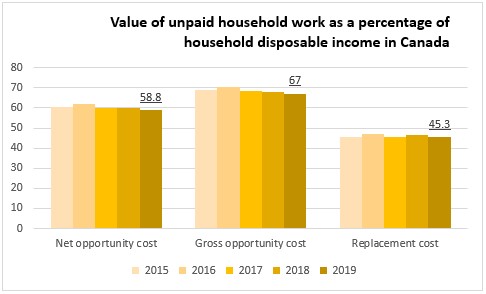
The value of unpaid household work as a percentage of household disposable income (HDI) based on gross opportunity cost decreased to 67.0% in 2019 and net opportunity cost decreased to 58.8% in 2019. The value of unpaid household work based on replacement cost decreased to 45.3% in 2019 from 26.0% in 2015.
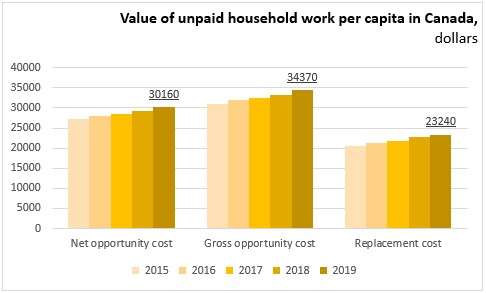
The value of unpaid household work per capita based on gross opportunity cost increased to $34,370 in 2019 and net opportunity cost increased to $30,160 in 2019. The value of unpaid household work based on replacement cost increased to $23,240 in 2019.
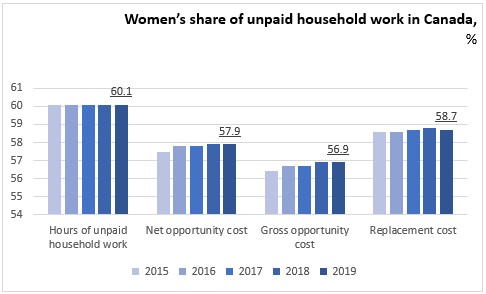
Women continued to do majority of unpaid household work compared to men while their share of total value of unpaid household work was lower than their share of hours. This difference is driven by the market wage gap between men and women.
Women’s share of total value of unpaid household work based on gross opportunity cost was 56.9% in 2019 and net opportunity cost was 57.9% in 2019. Women’s share of total value of unpaid household work based on replacement cost was 58.7% in 2019.

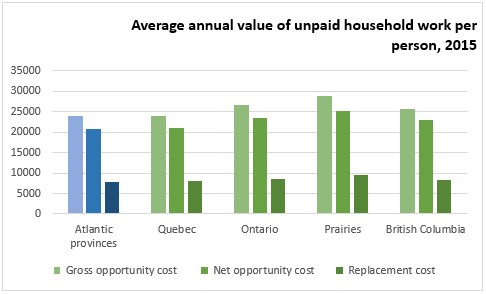
The average annual hours of unpaid household work per person was the highest in Atlantic provinces and the lowest in British Columbia. The value of unpaid household work was the largest in the Prairies due to higher average unpaid household hours and higher wages. The value of unpaid household work was the lowest in the Atlantic provinces on lower average wages.
Across the five regions of Canada, women had a similar share of hours of unpaid household work, ranging from 58.7% (British Columbia) to 61.3% (Ontario). Women's wages growth outpaced men's wages growth in all regions except Quebec from 2015 to 2019, regardless of the valuation method.

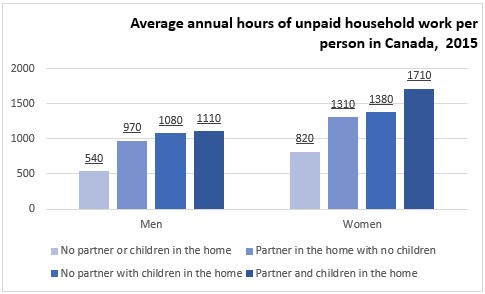
Women tended to do more unpaid household work regardless of marital status and the presences of children. The presence of children increased the hours of unpaid work for both men and women. Literature suggests that differences are driven by societal expectations placed on women to have clean homes.
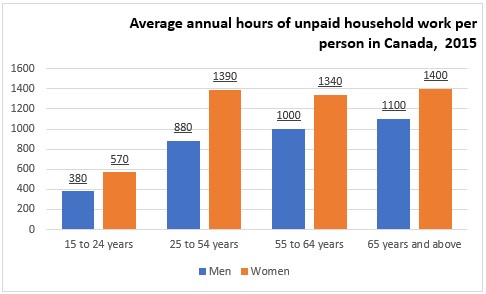
Women in all age groups spend more time on unpaid household work compared with men. Older men spend more time on unpaid household work than younger men.
Women spent more time on all activities of unpaid household work compared with men. Men’s allocation of time spent on each activity is similar to women despite doing less unpaid household work on each activity. Men spent a slightly larger proportion of time on household chores or maintenance and a smaller proportion of time caring for children and adults in the home compared with women.


Source: Statistics Canada; Estimating the economic value of unpaid household work in Canada, 2015 to 2019
<--- Return to Archive