The Economics and Statistics Division maintains archives of previous publications for accountability purposes, but makes no updates to keep these documents current with the latest data revisions from Statistics Canada. As a result, information in older documents may not be accurate. Please exercise caution when referring to older documents. For the latest information and historical data, please contact the individual listed to the right.
<--- Return to Archive
For additional information relating to this article, please contact:
August 03, 2022HOUSEHOLD INCOME AND CONSUMPTION, Q1 2022 Household Income
In addition to compensation of employees, household income also includes net mixed income (generated from unincorporated businesses), property income received (generated as the result of ownership of assets) and current transfers received (generally from government).
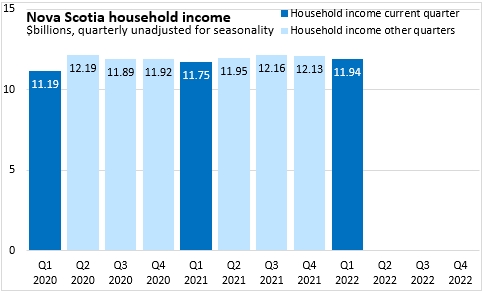
In Q1 2022, Nova Scotia's household income was $11.94 billion or $25,951 per household. Nova Scotia's income per household amounted to 76.7% of the national average per household. The highest income per household was in Alberta and the lowest in Prince Edward Island.
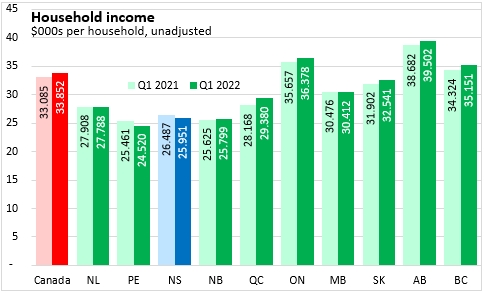
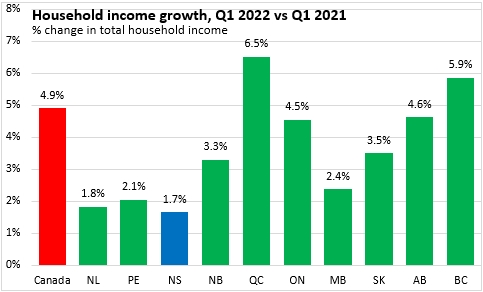
From Q1 2021 to Q1 2022, Nova Scotia's overall household income increased 1.7% (the number of households grew at a faster pace, so income per household contracted). National household income growth was 4.9% with the fastest growth in Ontario. All ten provinces reported rising household income. Nova Scotia reported the slowest household income growth among provinces.
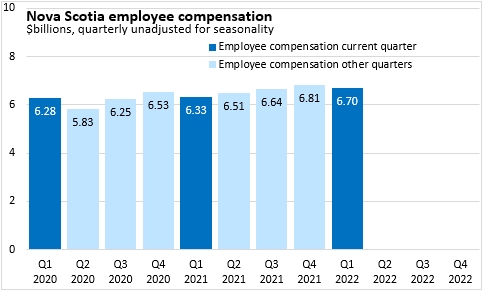
Nova Scotia's employee compensation was $6.70 billion in Q1 2022 or $14,555 per household (70.2% of the national average per household). Across Canada, employee compensation per household was $20,721. Alberta reported the highest employee compensation per household and Prince Edward Island the lowest.

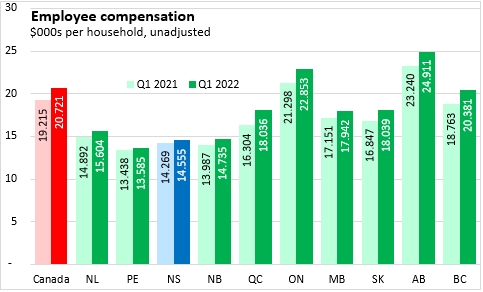
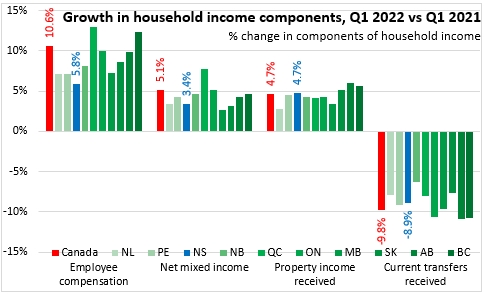
Nova Scotia's overall employee compensation was up 5.8% from Q1 2021 to Q1 2022. National employee compensation increased 10.6%.
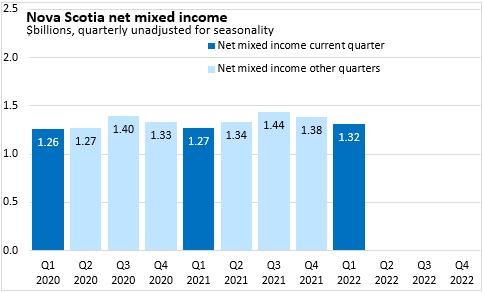
Net mixed income generated by unincorporated businesses amounted to $1.32 billion or $2,859 per household (86.0% of the national average per household). Across Canada, average per household net mixed income was $3,325 with the highest values in British Columbia and the lowest in New Brunswick.
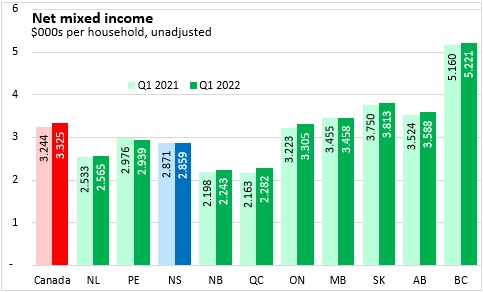
From Q1 2021 to Q1 2022, net mixed income grew by 3.4% (5.1% nationally).
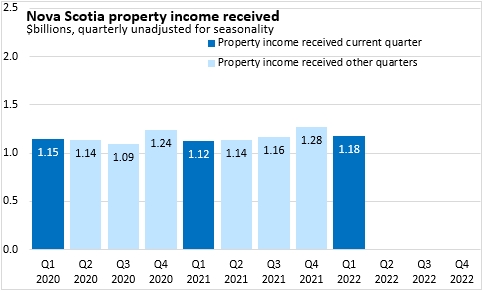
Nova Scotia property income in Q1 2022 was $1.18 billion or $2,556 per household (77.7% of the national average). National property income per household was $3,288 with the highest values in Alberta and the lowest values in Newfoundland and Labrador.
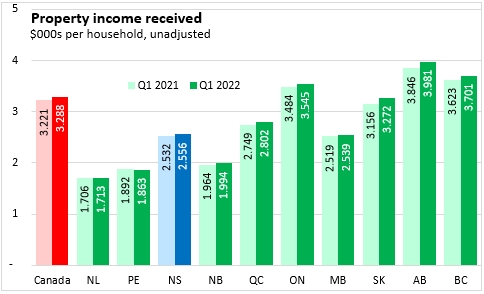
From Q1 2021 to Q1 2022, property income receipts increased by 4.7% in Nova Scotia - the same as the national pace.
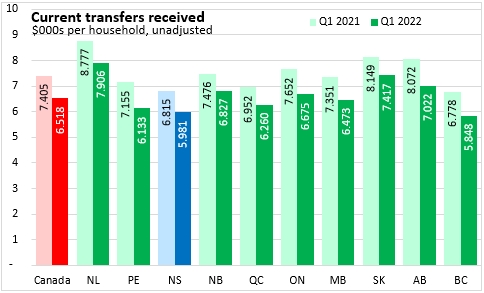
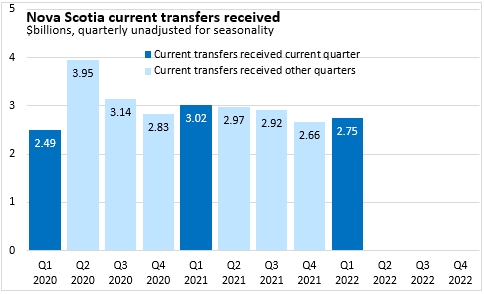
As many COVID-related support programs have been withdrawn, current transfers received in Nova Scotia were down to $2.75 billion in Q1 2022. This was a decline of 8.9% from Q1 2021 (-9.8% national decline). Current transfers received were $5,981 per household in Nova Scotia (91.8% of the national average per household). Transfers per household were highest in Newfoundland and Labrador and lowest in British Columbia (followed by Nova Scotia).
Household Consumer Expenditures
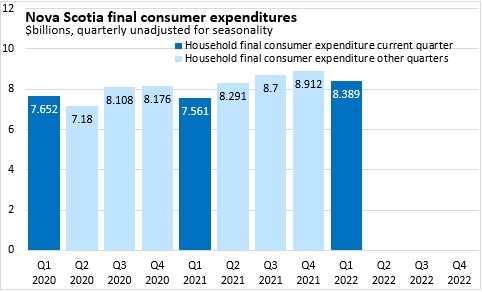
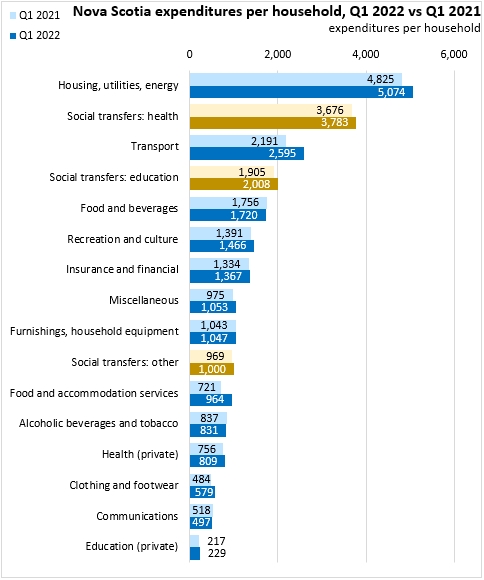
Nova Scotia's final consumer expenditures (paid for private by households) amounted to $8.39 billion in Q1 2022. This was $18,232 per household (88.9% of the national average per household). Across Canada, final consumer expenditures per household were $20,506 with the highest value in Alberta and the lowest in Quebec.
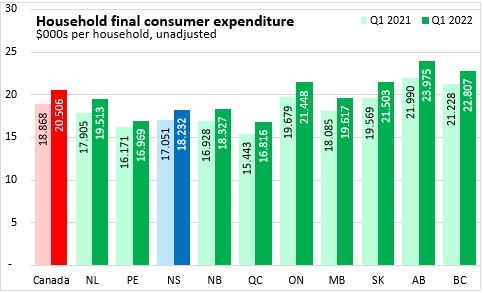
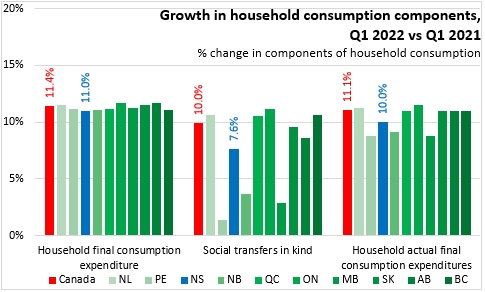
Between Q1 2021 and Q2 2022, final consumer expenditures increased by 11.0% (11.4% nationally), which includes the effects of price increases over this period.
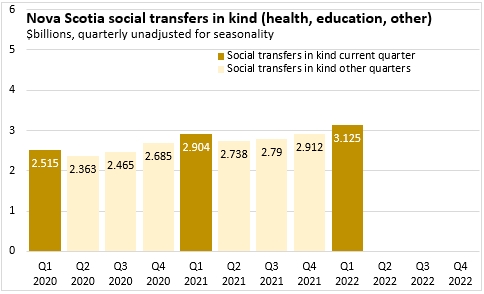
Social transfers in kind refer to services that are provided for the benefit of households but are paid for by governments and non-profits. These are primarily health and education expenditures, which add to private expenditures made on these services. In Q1 2022, Nova Scotian households received $3.13 billion worth of social transfers in kind. This amounted to $6,791 per household (98.7% of the national average per household). Across Canada, social transfers in kind were $6,862 per household with the highest values in Saskatchewan and the lowest value (by a large margin) in Prince Edward Island.
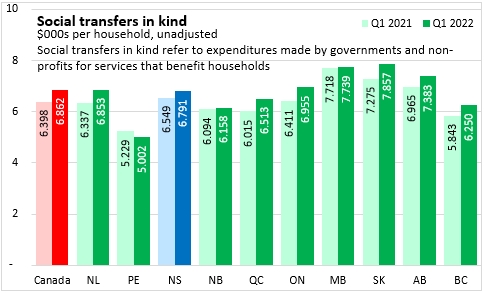
Between Q1 2021 and Q1 2022, the value of social transfers in kind in Nova Scotia increased by 7.6% (10.0% growth nationally).
The sum of household final consumer expenditures and social transfers in kind is termed 'household actual final consumption expenditures', which reflects the benefits to households from both private expenditures as well as services provided by governments and non-profits.
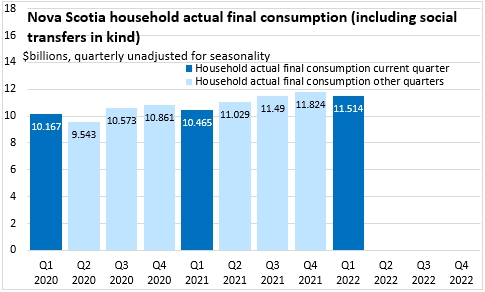
Nova Scotia's household actual final consumption expenditures in Q1 2022 were $11.51 billion or $25,023 per household (91.4% of the national average per household). National household actual final consumption expenditures were $27,368 per capita with the highest value in Alberta and the lowest value in Prince Edward Island.
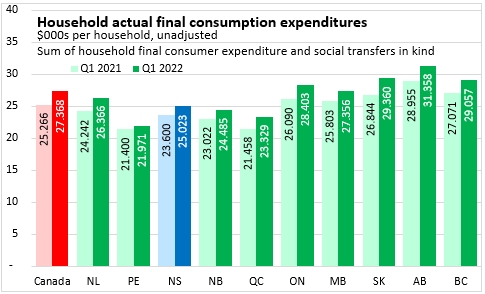
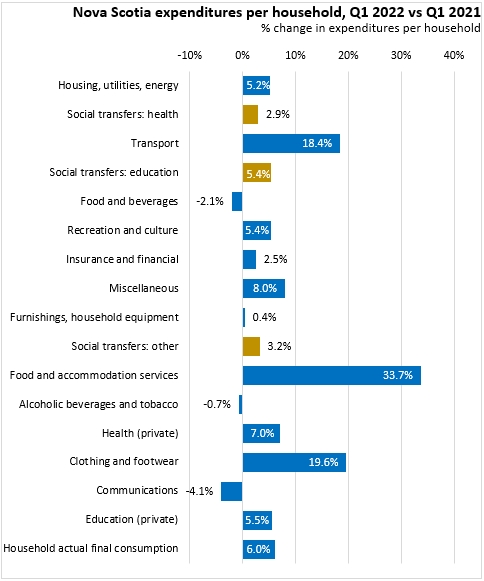
From Q1 2021 to Q1 2022, household actual final consumption expenditures increased by 10.0% in Nova Scotia (11.1% nationally).
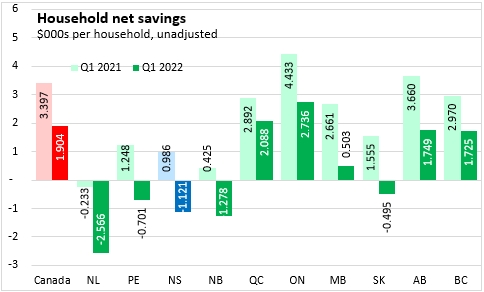
Household net savings (which includes changes in pension entitlements) increased during the pandemic. These effects appear to have been temporary and savings are returning to prior trends. After saving an average of $986 per household in Q1 2022, Nova Scotia's net savings per household were -$1,121 in Q1 2022. All Atlantic provinces and Saskatchewan reported negative net savings in Q1 2022. Ontario reported the largest positive net savings per household.
Household actual final consumption expenditures per household in Nova Scotia increased by 6.0% from Q1 2021 to Q1 2022. Growth was fastest for food/accommodation services, clothing/footwear and transportation. Average expenditures on communications, alcohol/tobacco and food/beverage were down.
Notes: As part of its new quarterly data for Distribution of Household Economic Accounts, Statistics Canada is now providing quarterly data on household income, household final consumption expenditures and household wealth. This information is available for provinces as well as for income quintiles and age groups.
These quarterly results supplement previously-available provincial data for compensation of employees and investment in fixed capital stock. These concepts align with the Provincial and Territorial Economic Accounts, but they remain subject to revision in future releases.
Source: Statistics Canada. Table 36-10-0663-01 Distributions of household economic accounts, income, consumption and saving, Canada, provinces and territories, quarterly (x 1,000,000)
<--- Return to Archive