The Economics and Statistics Division maintains archives of previous publications for accountability purposes, but makes no updates to keep these documents current with the latest data revisions from Statistics Canada. As a result, information in older documents may not be accurate. Please exercise caution when referring to older documents. For the latest information and historical data, please contact the individual listed to the right.
<--- Return to Archive
For additional information relating to this article, please contact:
November 08, 2022PROVINCIAL GDP BY INDUSTRY 2021 [REVISED] Statistics Canada released revised estimates of real GDP by industry for the provinces and territories in 2021.
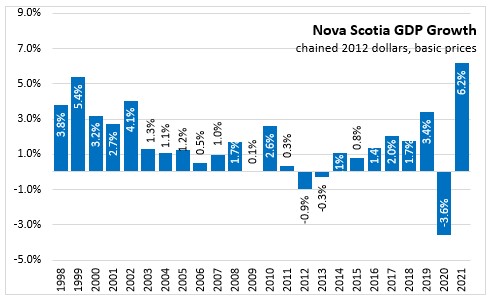
Real GDP growth is measured at the industry level with chained 2012 dollars at basic prices (sellers' prices before taxes less subsidies on products) that removes the effect of price changes. Nova Scotia's real GDP increased 6.2% in 2021 following a 3.6% decline reported in 2020. This was the second largest real GDP increase among provinces and was mainly driven by higher household spending.
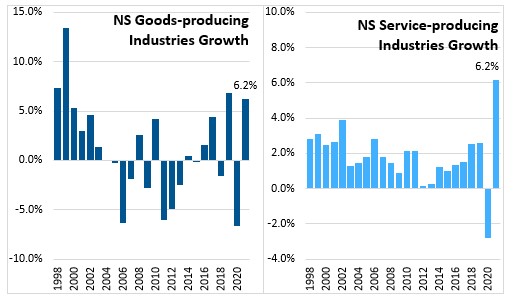
Goods-producing and service-producing industries both increased 6.2% in 2021.
In goods producing industries, real GDP decline in mining, quarrying and oil and gas extraction was more than offset by the gains in other subsectors.
- Crop production excluding cannabis increased 10.0% with licensed cannabis production up 10.9%. Animal production was up 2.0% while aquaculture declined 9.4%.
- Real GDP from forestry/logging (not including processing industries) increased 1.6% with support activities for forestry increasing 3.6%.
- Fishing, hunting and trapping real GDP increased by 9.0% in 2021.
- Real GDP in mining and quarrying was down 16.8%.
- Utility real GDP was increased 1.4%.
- Construction real GDP was up 10.2% mainly driven by higher activity in residential construction (+13.0). Non-residential building construction increased 0.9% in 2021 with gains in engineering construction offsetting lower activity in oil and gas, and communication engineering construction.
- Manufacturing real GDP increased 8.0%.
- Food manufacturing was up 8.4% with increased activity in most subsectors led by sugar and confectionery product manufacturing (+21.4%). Seafood product preparation and packaging increased 15.1%. Fruit and vegetable preservation (-11.9%), grain and oilseed milling (-28.6%) and breweries (-9.3%) declined in 2021.
- Sawmills real GDP was up 3.2% with pulp, paper and paperboard mills increasing 1.2%.
- Pharmaceutical (+22.6%), plastics (+11.4%), cement/concrete (+17.9%), and medical equipment/supplies (+40.1%) had increases in activity in 2021.
- Clothing and leather (-40.7%), basic chemical manufacturing (-40.1%), primary metal manufacturing (-25.0%), motor vehicle parts (-30.4%) were among subsectors with lower real GDP activity in 2021.
Service-producing industries GDP increased by 6.2% with only management of companies and enterprises showing decline last year.
- Wholesale real GDP (+10.2%) increased with higher activity in most subsectors. Food, beverage and tobacco wholesalers was up 28.6% in 2021.
- Retail real GDP increased 9.4% with higher activity in clothing stores (+21.3%), and sporting goods, hobby, book and music stores (+18.2%). Real GDP declined in unlicensed cannabis stores (-11.6%) and non-store retailers (-2.9%).
- Transportation and warehousing (+5.3%) increased despite a 14.9% decline in air transportation. Real GDP increased in rail transportation (+1,1%), water transportation (+5.5%), truck transportation (+9.5%), couriers and messengers (+8.2%) and warehousing and storage (+5.4%).
- Information and cultural industries increased 2.2% supported by increased in periodical, book and directory publishers (+18.2%), motion pictures and video industries (+13.6%), sound recording (+11.8%) and radio and television broadcasting (+9.2%). Newspapers publishers (-2.5%), motion picture and video exhibition (-6.2%), and data processing, hosting and related services (-2.7%) had lower economic activity in 2021.
- Within finance and insurance (+4.7%), activity increased for banks (+4.0%), credit unions (+5.8%), and insurance carriers (+6.5%), and financial investment services (+14.7%).
- Real estate (+3.7%) was positive with growth for lessors of real estate (+2.5%), owner-occupied dwellings (the imputed non-market activity of households) (+2.9%), and offices of real estate agents (+23.3%) while real GDP in automotive equipment rental and leasing (-22.9%) and rental and leasing services (-8.8%) declined.
- Professional, scientific and technical services real GDP (+15.9%) increased with higher activity in all subsectors.
- Administrative and support, waste management and remediation services real GDP (+4.0%) increased in most subsectors. Employment services (-10.1%) and travel arrangement and reservation services (-21.5%) were the only two subsectors with real GDP decline in 2021.
Real GDP in educational services (+5.0%) increased with elementary and secondary schools (+8.0%) seeing larger gains than universities (+2.0%) and community colleges (+1.1%).
- Health care and social assistance (+5.1%) real GDP increased in all subsectors. The gains for the subsectors were: Offices of physicians (+6.4%), dentists (+18.5%), and miscellaneous ambulatory health care services (+7.9%) and hospitals (+2.5%), nursing and residential care facilities (+5.2%), social assistance (including day care) (+5.4%).
- Arts, entertainment and recreation (+17.6%) had the highest increase in real GDP 2021, with a 33.2% increase in GDP from amusement.
- Real GDP in accommodation and food services (+14.6%) was up with traveller accommodation (+22.0%) and food services and drinking places (+12.9%) seeing recovery after the reopening of the economy.
- Other services (except public administration) (+7.3%) increased with higher activity in most subsectors.
- Public administration real GDP increased 6.1% in 2021 with gains in federal (+12.4%), provincial (+3.2%) local/municipal (+3.1%), and Aboriginal (+11.5%) governments, and defense services (+5.1%).

The largest contribution to the increase in real GDP in 2021 came from public administration, professional, scientific and technical services, construction and retail trade.

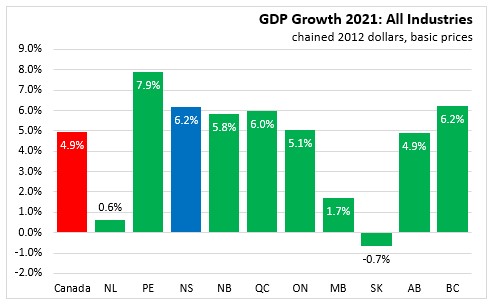
National real GDP at basic prices increased 4.9% in 2021. All provinces reported gains with the exception of Saskatchewan (-0.7%). Nova Scotia along with British Columbia (both at 6.2%) had the second largest increase among provinces in 2021 following Prince Edward Island (+7.9%).
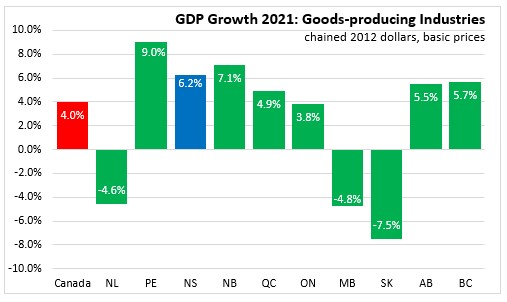
Goods industry real GDP increased 4.0% in Canada with declines in all but three provinces: Saskatchewan (-7.5%), Manitoba (-4.8%) and Newfoundland and Labrador (-4.6%). The largest increase among provinces was in Prince Edward Island (+9.0%).
Service industry real GDP increased 5.3% in Canada in 2021 with a 6.2% increase in Nova Scotia. All provinces reported higher services activity with the largest gains in Prince Edward Island (+7.5%), and British Columbia and Quebec (both at 6.4%).

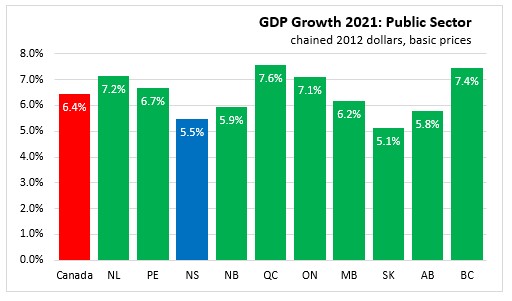
Public sector GDP (which is included in service industries) increased 6.4% in Canada and 5.5% in Nova Scotia in 2021. All provinces reported increases with the largest increase in Quebec (+7.6%) and the smallest in Saskatchewan (+5.1%).
Source: Statistics Canada. Table 36-10-0402-01 Gross domestic product (GDP) at basic prices, by industry, provinces and territories (x 1,000,000)
<--- Return to Archive