The Economics and Statistics Division maintains archives of previous publications for accountability purposes, but makes no updates to keep these documents current with the latest data revisions from Statistics Canada. As a result, information in older documents may not be accurate. Please exercise caution when referring to older documents. For the latest information and historical data, please contact the individual listed to the right.
<--- Return to Archive
For additional information relating to this article, please contact:
November 30, 2022NON-RESIDENTIAL FIXED CAPITAL INVESTMENT, Q3 2022 Non-residential fixed capital investment consists of expenditures made by business, governments and non-profit institutions serving households that add to the capital stock for production of goods and services in an economy. Investment that are included are buildings, engineering construction (i.e. bridge, mine structure), machinery and equipment, and intellectual property products (i.e. software, mineral exploration) but it doesn’t include non-reproducible assets (lands, mineral deposits, natural resources) or housing investment. Statistics Canada has begun to release quarterly data on non-residential fixed capital investment and stock for the provinces with historical data back to 2013. Note, the data is not seasonally adjusted and expressed in current prices.
Year-over-year (Q3 2022 vs Q3 2021)
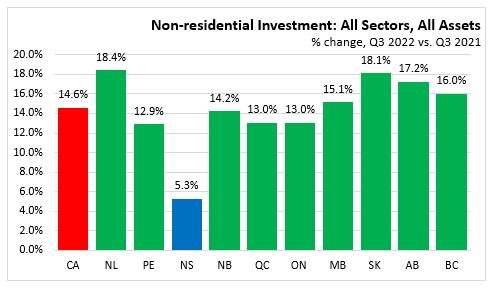
Nova Scotia non-residential investment (all sectors, all assets) increased 5.3% from Q3 2021 to Q3 2022. Non-residential investment increased in all provinces from the previous year. Nationally non-residential investment was up 14.6% with Newfoundland and Labrador (+18.4%) posting the largest increase and Nova Scotia posting the smallest gain.
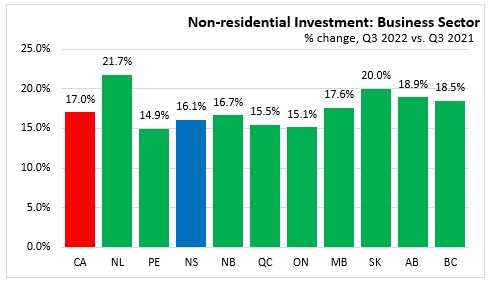
Business sector investment in Nova Scotia increased 16.1%. The business sector in Newfoundland and Labrador (+21.7%) reported the largest increase while the business sector in Prince Edward Island (+14.9%) reported the smallest increase.
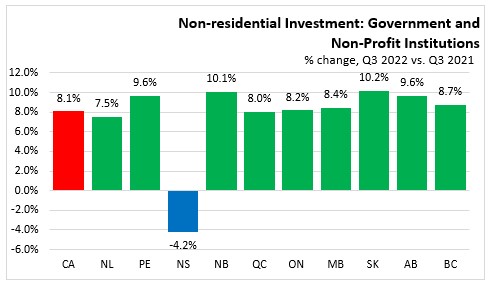
Government and non-profit fixed capital investment increased in every province compared to Q3 2021 with the exception of Nova Scotia (-4.2%). Saskatchewan (+10.2%) posted the largest gain.
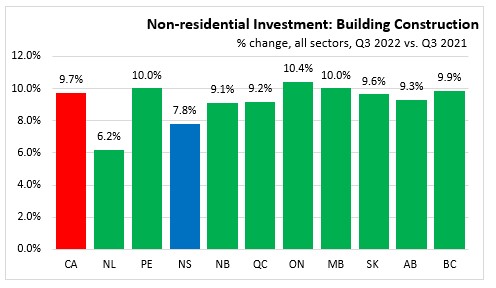
Compared to Q3 2021, non-residential investment in buildings was up 7.8% in Nova Scotia. National investment in non-residential building construction was up 9.7% with growth in all provinces.
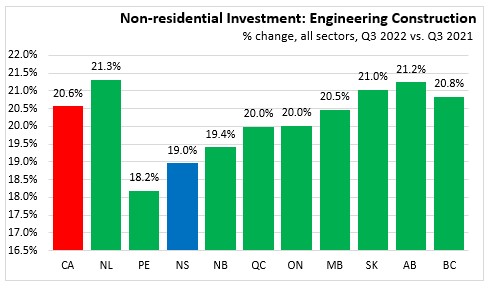
Engineering structure investment was up 19.0% in Nova Scotia. Investment in engineering structures was up 20.6% nationally with every province reporting year-over-year increases in Q3 2022. Newfoundland and Labrador (+21.3%) reported the strongest growth and Prince Edward Island (+18.2%) reported the smallest growth.
Machinery and equipment investment increased 16.7% in Canada, led by Alberta and Saskatchewan (both +18.6%). Nova Scotia (-6.6%) was the only province reporting a year over year decline in Q3 2022.

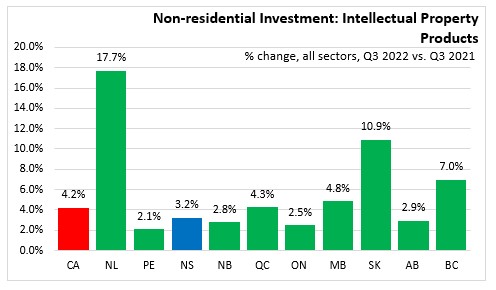
Intellectual property products was up 3.2% in Nova Scotia over Q3 2021. Intellectual property investment was up 4.2% in Canada led by growth in Newfoundland and Labrador (+17.7%).
Year-to-date (2022 Q1-Q3 vs 2021 Q1-Q3)
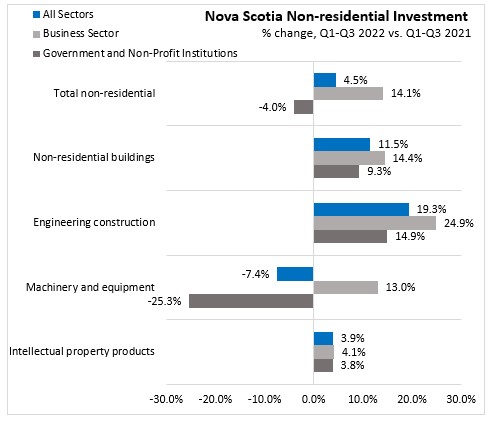
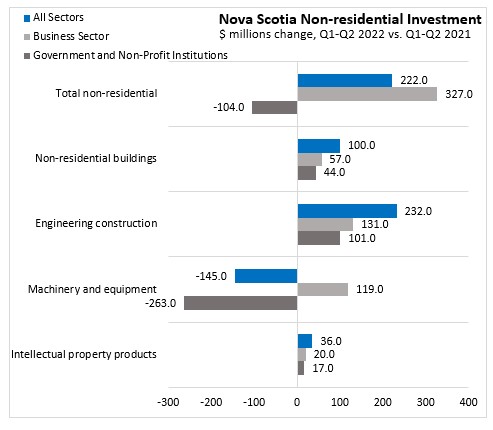
Non-residential investment in Nova Scotia increased 4.5% in 2022 Q1-Q3 compared to 2021 Q1-Q3. Business sector investment was up 14.1% (+$327 million) and the government and non-profit institution sector was down 4.0% (-$104 million). Business sector investment rose in all categories: buildings (+14.4%), engineering construction (+24.9%), machinery and equipment (+13.0%) and intellectual property products (+4.1%). For the government and non-profit sector, investment was 25.3% lower in machinery and equipment (-$263 million) while growing in the other components.
Trends
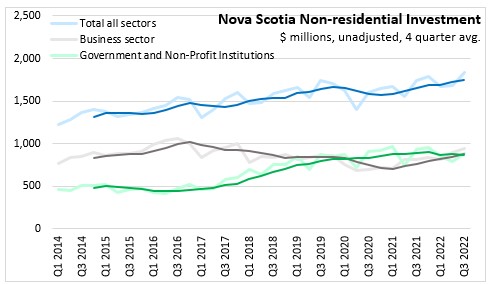
Nova Scotia non-residential investment has trended upwards since Q1 2014, rising from $1,226 million in Q1 2014 to $1,832 million in Q3 2022.
In Q3 2022, investment in Nova Scotia's fixed capital increased 9.0% from the previous quarter (unadjusted for seasonality). Business sector non-residential investment trended downward over 2016 to 2020, before beginning to pick up in 2021. Government and non-profit institution serving households was mostly flat from 2014 through 2017, but has since trended upwards.
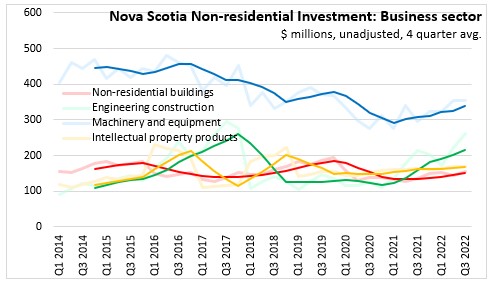
Within the business sector, machinery and equipment account for the largest share of fixed capital investments. Compared to Q3 2021, business sector investment increased 16.1%. The decline in machinery and equipment (-6.6%) was more than offset by increases in non-residential buildings (+7.8%), engineering construction (+19.0%) and intellectual property products (+3.2%).
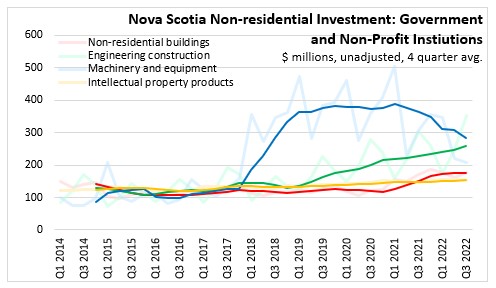
Government investment in machinery and equipment rose through 2018 and remained at elevated levels averaging above $300 million per quarter from 2019 to 2021. Government and non-profit investment in machinery and equipment was down in Q3 2022 compared to the same period one year ago by 4.2%. In Q3 2022 vs. Q3 2021, investment was also higher for government and non-profit institutions investment in non-residential buildings (+2.9%), engineering construction (+16.9%) and intellectual property products (+4.1%). Government and non-profit investment in engineering construction and non-residential buildings have been trending upward.
Statistics Canada. Table 34-10-0163-01 Flows and stocks of fixed non-residential and residential capital, by sector and asset, provincial and territorial (x 1,000,000)
<--- Return to Archive