The Economics and Statistics Division maintains archives of previous publications for accountability purposes, but makes no updates to keep these documents current with the latest data revisions from Statistics Canada. As a result, information in older documents may not be accurate. Please exercise caution when referring to older documents. For the latest information and historical data, please contact the individual listed to the right.
<--- Return to Archive
For additional information relating to this article, please contact:
January 05, 2023NOVA SCOTIA INTERNATIONAL GOODS EXPORTS, NOVEMBER 2022 Year over year (November 2022 vs November 2021, domestic exports on a customs-basis, unadjusted)
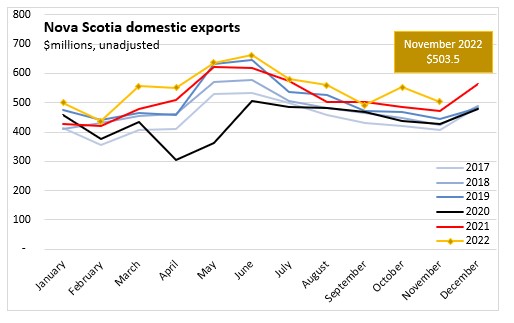
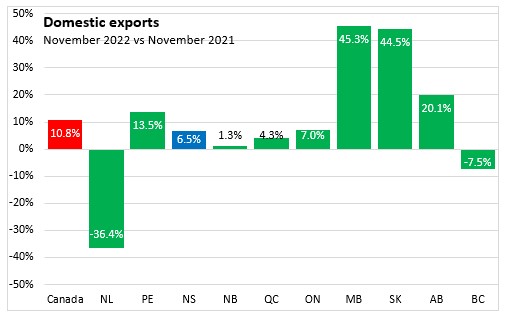
Nova Scotia international goods exports were $503.5 million in November 2022, an increase of 6.5% compared to November 2021.
Canada's goods exports were up 10.8%. Newfoundland and Labrador and British Columbia were the only two province which reported year-over-year declines in November 2022. The largest increases were in Manitoba, Saskatchewan and Alberta.
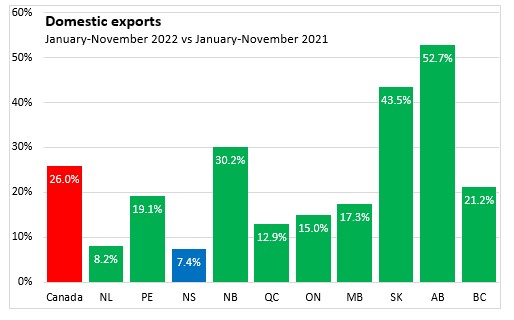
Year-to-Date (January-November 2022 vs January-November 2021, domestic exports on a customs-basis, unadjusted)
Nova Scotia's international goods exports totalled $6,029.9 million over the first eleven months of the year up 7.4% from the same months in 2021. In Canada, international goods exports were up 26.0% with gains in all provinces. The fastest export growth was reported in Alberta, Saskatchewan and New Brunswick, the slowest growth was reported in Nova Scotia.
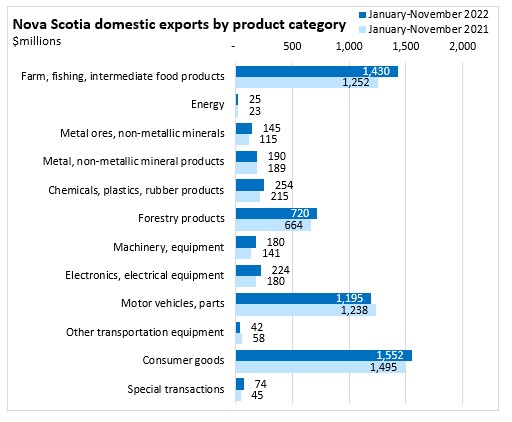
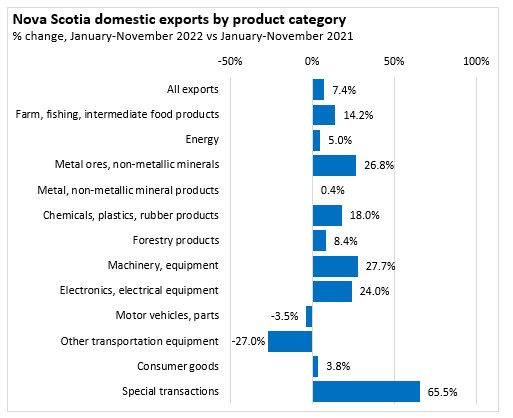
Among broad product categories, Nova Scotia's year-to-date exports growth was most attributable to gains in farm, fishing and intermediate food products as well as consumer goods and forestry products. In percentage terms, the fastest gains for specified categories (excluding special transactions) were in machinery and equipment, metal ores and non-metallic minerals, electronics and electrical equipment, and chemical, plastic and rubber products. All commodity categories have increased with the exception of other transportation equipment and motor vehicles/parts.
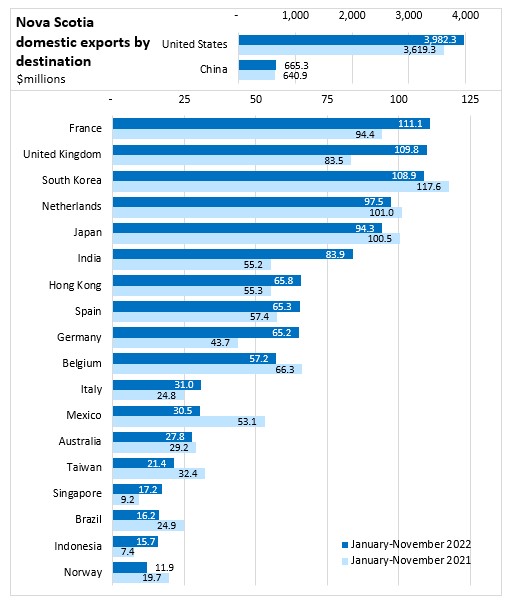
The US is by far Nova Scotia's largest destination for international goods exports. Through the first eleven months of 2022, Nova Scotia's exports of goods to the US were up 10.0% to $3,982.3 billion.
China is Nova Scotia's second largest export destination. Nova Scotia exports to China were up 3.8% to $665.3 million through the first eleven months of 2022.
Following China, the next largest export destinations through the first eleven months of the year were France (+17.8% to $111.1 million), the UK (+31.5% to $109.8 million), South Korea (-7.4% to $108.9 million), and the Netherlands (-3.6% to $97.5 million). Among Nova Scotia's major trading partners, the fastest percentage growth in domestic exports was to Indonesia (+110.7% to $15.7 million).

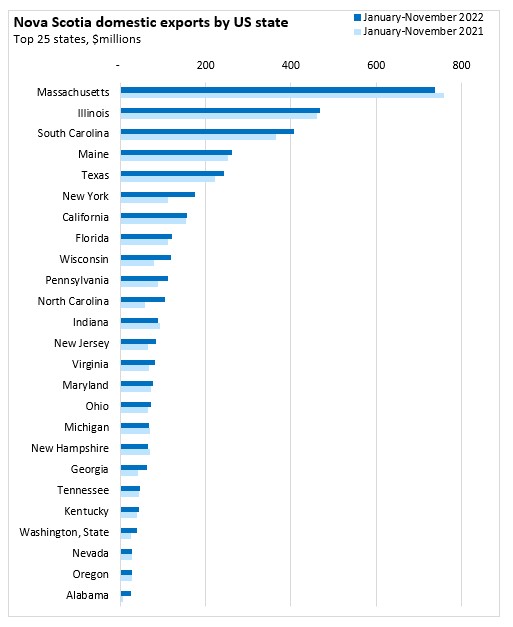
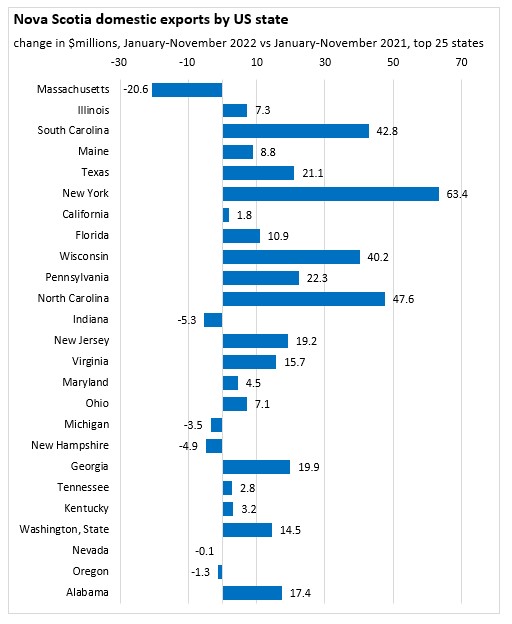
Nova Scotia's exports to the US accounted for 66.0% of year-to-date exports. Massachusetts alone was a larger export destination than China with $739.1 million in shipments through the first eleven months of 2022 (-$20.6 million compared to the first eleven months of 2021). Through the first eleven months of 2022, the next largest US state destinations for Nova Scotia exports were: Illinois (+$7.3 million to $467.9 million), South Carolina (+$42.8 million to $407.4 million), Maine (+$8.8 million to $262.7 million), Texas (+$21.1 million to $242.7 million), New York (+$63.4 million to $176.0 million), California (+$1.8 million to $156.4 million), Florida (+$10.9 million to $122.1 million), and Wisconsin (+$40.2 million to $119.8 million). Each of these states would rank above France as an export destination for Nova Scotia goods producers.
Source: Statistics Canada. Table 12-10-0119-01 International merchandise trade by province, commodity, and Principal Trading Partners (x 1,000); Table 12-10-0099-01 Merchandise imports and exports, customs-based, by Harmonized commodity description and coding system (HS) section, Canada, provinces and territories, United States, states (x 1,000)
<--- Return to Archive