The Economics and Statistics Division maintains archives of previous publications for accountability purposes, but makes no updates to keep these documents current with the latest data revisions from Statistics Canada. As a result, information in older documents may not be accurate. Please exercise caution when referring to older documents. For the latest information and historical data, please contact the individual listed to the right.
<--- Return to Archive
For additional information relating to this article, please contact:
May 01, 2023PROVINCIAL GDP BY INDUSTRY 2022 [PRELIMINARY] Statistics Canada released preliminary estimates of real GDP by industry for the provinces and territories in 2022.
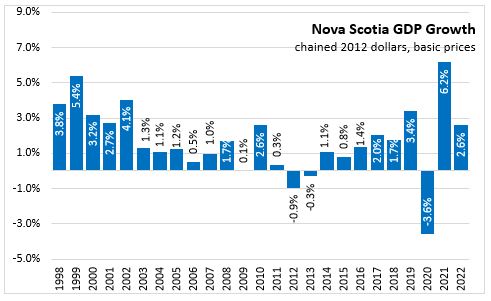
Real GDP growth is measured at the industry level with chained 2012 dollars at basic prices (sellers' prices before taxes less subsidies on products) that removes the effect of price changes. Nova Scotia's real GDP increased 2.6% in 2022 following a 6.2% increase in 2021 and the 3.6% decline reported in 2020. Compared with 2019, the Nova Scotia economy was 5.1% larger in 2022.
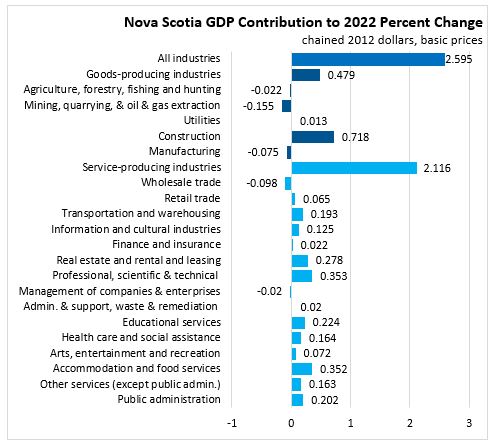
Goods-producing real GDP grew 2.5% and service-producing industries increased 2.6% in 2022. Compared with 2019, goods-producing industries are 1.7% larger while service-producing industries are 5.9% larger.

In goods producing industries, real GDP increases in construction and to a lesser extent utilities offset declines in resources, mining, quarrying and oil and gas extraction and manufacturing.
- Crop production excluding cannabis decreased 2.8% while licensed cannabis production grew 24.9%. Animal production was up 1.9% while aquaculture declined 15.2%.
- Real GDP from forestry/logging (not including processing industries) decreased 3.7% with support activities for forestry down 16.3%.
- Fishing, hunting and trapping real GDP increased by 0.2% in 2022, following a 9.0% increase in 2021.
- Real GDP in mining and quarrying was down 19.4% with lower activity in gold ore mining offsetting an increase in non-metallic mineral mining.
- Utilities real GDP increased 0.7% but remains below 2019 levels.
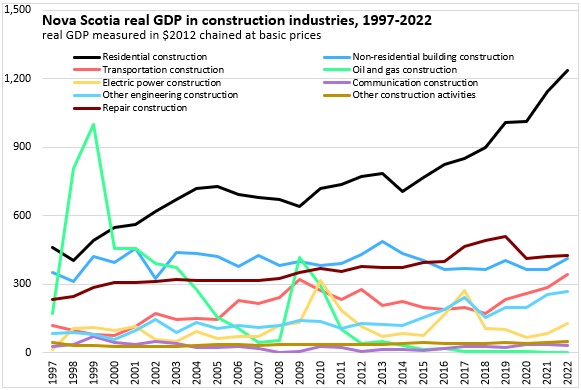
- Construction real GDP was up 10.7% on increases in residential construction (+8.0%), non-residential building (+12.4%), and engineering construction (+18.9%).
- Engineering construction was up in transportation, oil and gas (small sector), electric power, and other engineering construction while only declining in communication engineering construction.
- Repair construction had a small increase of 0.9%
- Manufacturing real GDP declined 1.0% in 2022 but remains 1.6% larger than in 2019.
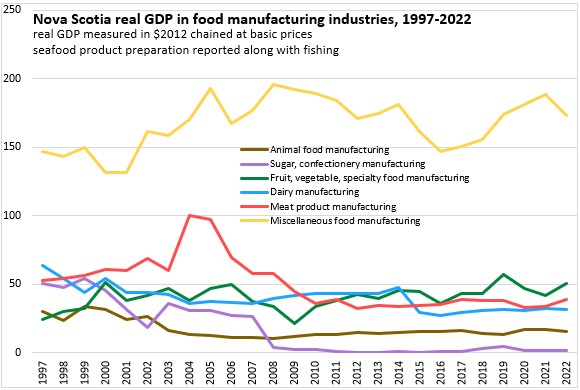
- Food manufacturing was down 2.7% with decrease in most subsectors including animal food (-4.8%), sugar/confectionery products (-11.8%), dairy (-2.5%), seafood (-3.8%), bakeries (-7.5%), and other food manufacturing (-9.4%). Fruit/vegetable and meat manufacturing were up.
- Wood product manufacturing declined 7.2% with declines in sawmills (-13.1%), other wood products (-6.1%), and converted paper products (-2.2%) offsetting increases in veneer, plywood and engineered wood products (+13.7%) and pulp and paper mills (+0.4%).
- Pharmaceutical (+5.9%), rubber products (+0.6%), non-metallic mineral products (+5.0%), cement/concrete products (+3.8%), fabricated metals product (+4.4%), machinery (+5.7%), computer/electronic products (+0.8%) were the large manufacturing sectors with increases in 2022.
- Plastic product (-6.9%), electric equipment/appliances/components (-9.6%), aerospace products/parts (-3.8%), and ship/boat building (-4.5%) declined in 2022.
Service-producing industries GDP increased by 2.6% with recovery from the pandemic supporting growth in transportation; arts, entertainment and recreation; accommodation and food services; and other services. Wholesale trade and management of companies declined in 2022.
- Wholesale real GDP (-2.9%) decreased with declines in food, beverage and tobacco; motor vehicles and parts; and building material wholesalers. Miscellaneous merchant wholesalers grew 26.8%.
- Retail real GDP increased 0.9% with higher activity at clothing, health/personal care, furniture, general merchandise. Lower real GDP occurred with motor vehicles, electronics, food, and gasoline stations. Real GDP declined 9.0% for unlicensed cannabis stores and increased 15.9% for license cannabis stores.
- Transportation and warehousing (+6.5%) was up with air transportation up 246.4% (still 35.5% below 2019 levels). Rail (+5.4%), water (+4.6%), transit/ground passenger (+5.4%), urban transit systems (+3.8%), taxi/limousine (+18.3%), support activities (+12.6%) were all also growing in 2022. Truck transportation (-0.2%), pipeline transportation (-1.1%), postal services (-5.3%) and couriers (-15.0%) were down.
- Information and cultural industries increased 4.1% supported by growth in periodical/book publishers, software publishers, motion picture/video exhibition, motion picture/video productions, radio/tv broadcasting, telecommunications, data processing/hosting, and other information services.
- Within finance and insurance (+0.4%), activity increased for banks (+1.9%), non-depository credit intermediation (+1.3%), and financial investment services (+6.3%) while declining among local credit unions (-1.8%), activities related to credit intermediation (-5.2%), insurance carriers (-4.6%) and insurance agents/brokers (-3.8%).
- Real estate (+1.5%) was positive with growth for lessors of real estate (+1.5%) and owner-occupied dwellings (+3.4%) offsetting a decline in real estate agents/offices (-23.8%).
- Professional, scientific and technical services real GDP (+7.0%) increased with growth in all subsectors except legal services (-4.6%). Strong growth was reported in architectural/engineering (+9.0%), special design services (+23.8%), scientific research and development (+16.3%), computer systems design (+15.1%), and advertising/public relations (+7.7%).
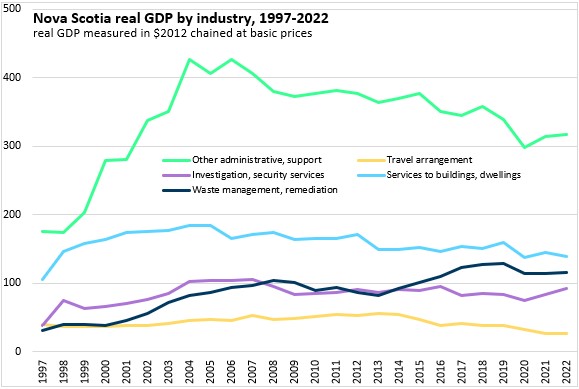
- Administrative and support, waste management and remediation services real GDP (+1.0%) was up in office administrative services, business support services, travel arrangements, investigation/security services and waste management while declining in employment services, facilities services, and services to buildings/dwellings.
- Real GDP in educational services (+3.3%) increased with elementary and secondary schools (+4.1%), community colleges (+6.4%), universities (+2.3%), and other educational services (+10.7%) all growing.
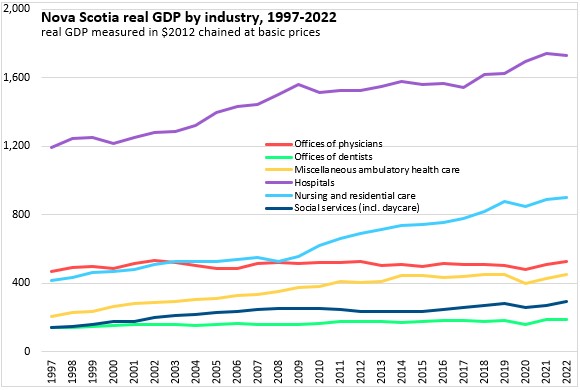
- Health care and social assistance (+1.5%) real GDP increased in all subsectors except hospitals (-0.6%). The gains for the subsectors were: Offices of physicians (+2.7%), dentists (+2.2%), and miscellaneous ambulatory health care services (+5.1%), nursing and residential care facilities (+1.4%), social assistance (including day care) (+7.3%).
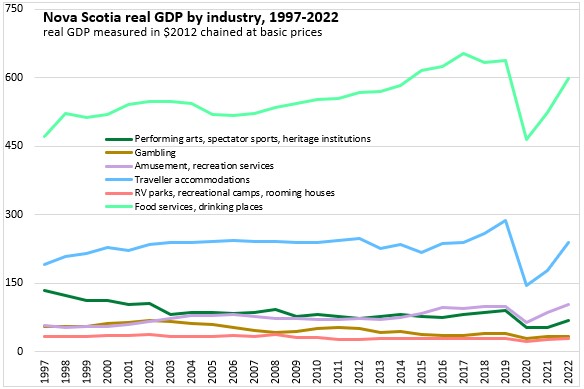
- Arts, entertainment and recreation (+18.8%) had the largest increase in real GDP 2022 with increases in performing arts/spectators’ sports/related industries (+26.9%) amusement and recreation (+20.1%) offsetting a 1.5% declining in gambling industries.
- Real GDP in accommodation and food services (+18.1%) was up with traveller accommodation (+35.7%) and food services and drinking places (+14.0%) continuing to recovery with further reopening after pandemic restrictions.
- Other services (except public administration) (+8.2%) increased with broad-based increases in all subsectors that includes automotive repair, other repairs services, personal services, dry cleaning/laundry services, funeral services, religious organization, and civic/professional organizations.
- Public administration real GDP increased 1.6% in 2022 with increases in defense services (+0.2%), non-defense federal public administration (+5.0%), local/municipal (+1.3%) and aboriginal public administration (+5.4%). Provincial public administration real GDP was essentially unchanged (0.0%).

The largest contribution to the increase in real GDP in 2022 came from construction, professional, scientific, and technical services, and accommodation and food services.
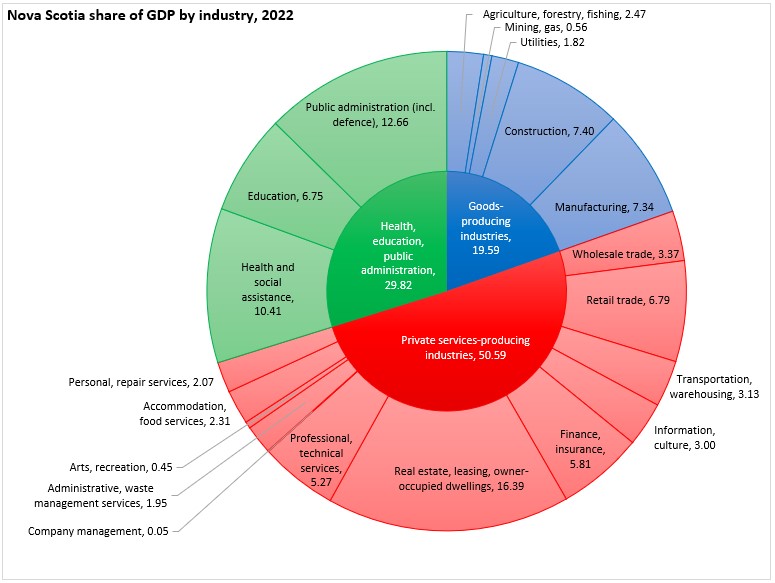
In Nova Scotia's real GDP for 2022 19.6% was generated by goods-producing industries, 50.6% by largely private services-producing industries and 29.8% by health, education and public administration (though health and education include some private sector producers).
National real GDP at basic prices increased 3.6% in 2022. All provinces reported gains except for Newfoundland and Labrador (-1.7%). Saskatchewan (+5.7%) and Alberta (+5.1%) had largest increase among provinces in 2022.

Goods industry real GDP increased 3.3% in Canada with gains in in all provinces except Newfoundland and Labrador (-6.3%). Saskatchewan (+10.3%), Manitoba (+7.8%), and Alberta (+6.6%) had the largest increase among the provinces.

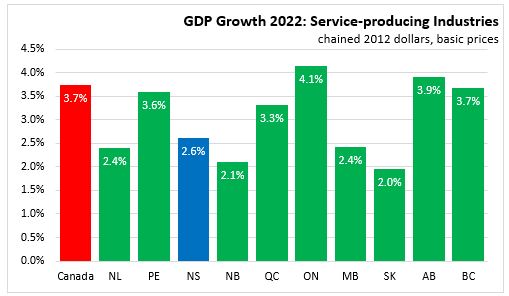
Service industry real GDP increased 3.7% in Canada in 2022 with increases in all provinces. Ontario (+4.1%) had the fastest growth and Saskatchewan (+2.0%) the slowest.
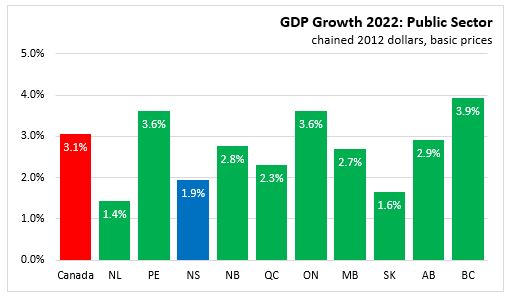
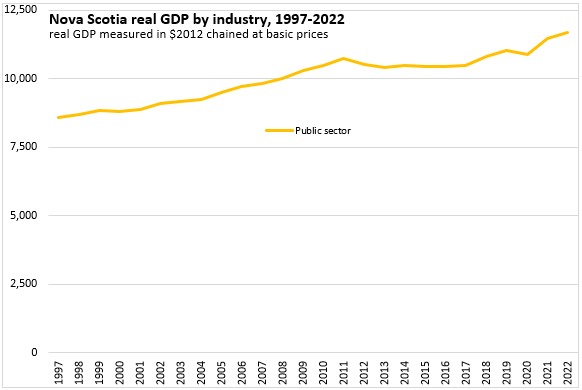
Public sector GDP (which is included in service industries) increased 3.1% in Canada and 1.9% in Nova Scotia in 2022. All provinces reported increases with the largest increase in British Columbia (+3.9%) and the smallest in Newfoundland and Labrador (+1.4%).
Trends in Nova Scotia real GDP by industry
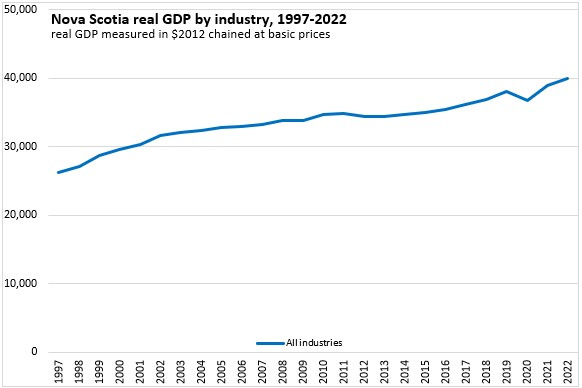
In the 26 years of data from 1997 to 2022, there have been notable changes in the real GDP generated by specific industries. These charts show the value of real GDP from 1997-2022 for most industries in the Nova Scotia economy. Real GDP is measured in 2012 (chained) dollars at basic prices. Changes in the level of real GDP for each industry indicate how its real output has changed, absent the effects of changes in output prices.
Nova Scotia's real GDP grew more rapidly from 1997-2002 as new production facilities (natural gas, supercalendered paper) were built and brought into production. Real GDP growth slowed, but remained largely positive from 2002-2011. In 2012 and 2013, Nova Scotia's real GDP contracted with industrial closures in forest products and petroleum refining as well as reductions in real GDP from the Federal government. Growth started to accelerate again from 2014 to 2019 before the contractions of the first waves of COVID-19 in 2020. Nova Scotia's real GDP rebounded quickly from the COVID recession of 2020 with stronger growth in both 2021 and 2022.
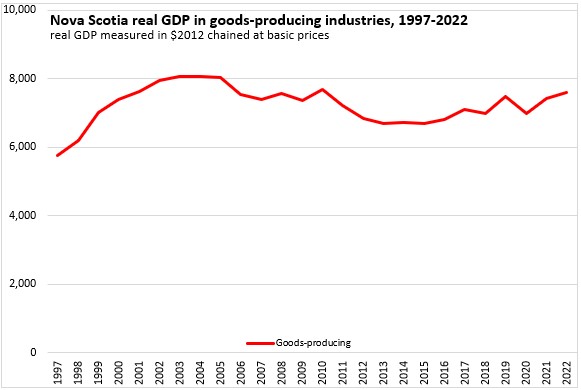
Real GDP from Nova Scotia's goods producing industries peaked in the early 2000s and trended down over the next ten years. Part of this contraction was due to slowing natural gas production as peak output on initial production is ordinary for this industry. Real GDP from Nova Scotia's goods-producing industries started to recover prior to the pandemic, but there was a contraction in 2020 (including the end of wood pulp production) before growing in the last two years.
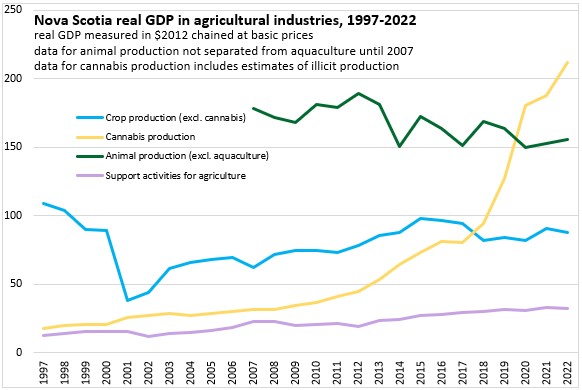
Nova Scotia's real GDP from agricultural industries has grown largely on rising cannabis production (this estimate includes illicit production). Although there are intermittent periods of faster growth and decline, real GDP from non-cannabis crops has grown slowly while real GDP from animal production has trended down.
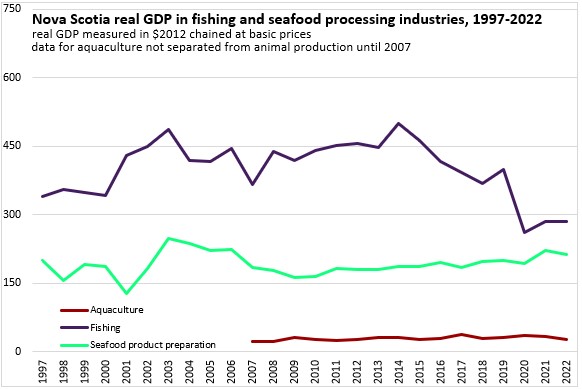
Real GDP from Nova Scotia's fishing and seafood industries has declined in recent years, despite rising export values. Although the volume of output has been lower, these industries have benefited from higher prices in more diverse markets.
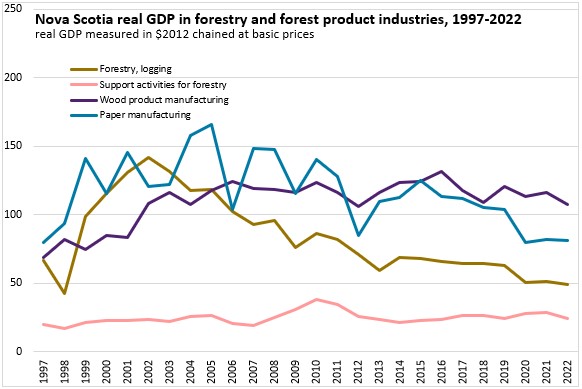
Nova Scotia's forestry and forest product industries have experienced substantial declines in recent decades, particularly with closures of paper production in 2012 and pulp production in 2020. Although real GDP from forestry declined, lumber production volumes have remained more stable.
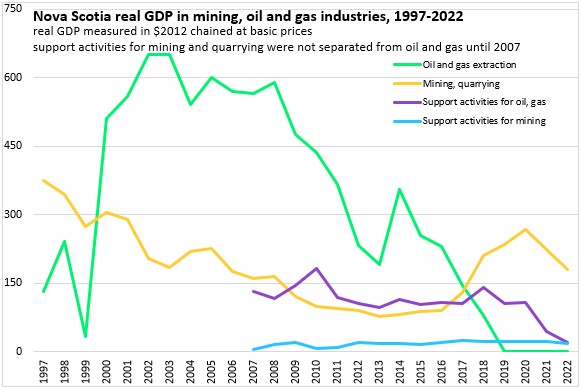
Nova Scotia's oil and gas output peaked in the early 2000s and ended by 2019. Mining and quarrying real GDP declined through 2013, but started to grow again from 2013-2020 before contracting again in the last two years.
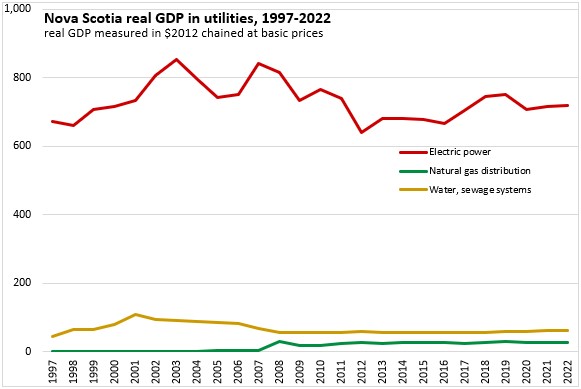
Nova Scotia's real GDP from electric power peaked in 2002 and declined over the next decade. There was a recovery in electric power real GDP before the pandemic.
Nova Scotia's real GDP in construction industries has been led by gains in residential building, transportation construction and repair construction. Real GDP from engineering construction such as electric power, oil and gas and communications exhibit periodic spikes associated with large projects.
Within Nova Scotia's (non-seafood) food manufacturers, real GDP has been dominated by miscellaneous categories, which include bakeries. Most other food manufacturing industries have relatively small real GDP with a notable decline observed almost 20 years ago in meat processing.
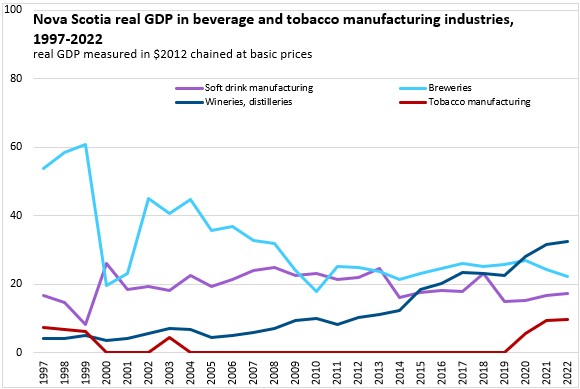
Real GDP from Nova Scotia's beverage and tobacco industries is notably smaller than from many other industries, but there has been a notable rise in real GDP from wineries and distilleries, offsetting downward trends in real GDP from breweries. There has been a recent increase in tobacco product manufacturing in Nova Scotia.
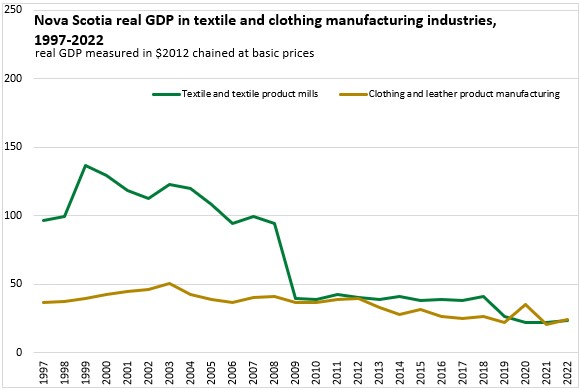
Nova Scotia's textile product mills reported a sharp decline in output in 2009. There was also a brief but sizeable increase in real GDP from clothing and leather manufacturers in 2020.
With the closure of the Dartmouth refinery in 2013, Nova Scotia's real GDP from petroleum product manufacturing fell to zero (it had been contracting for several years before that). Within chemical industries, there has been a steady increase in real GDP from Nova Scotia's pharmaceutical and medicine manufacturers.

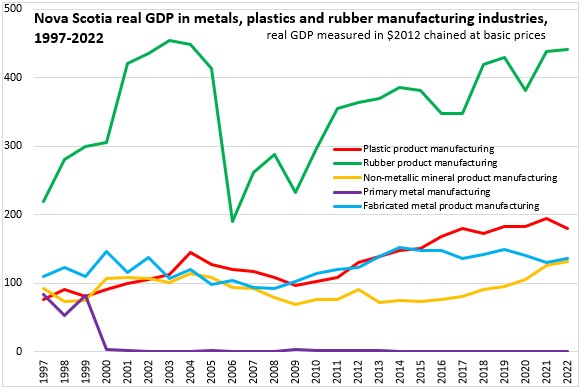
Real GDP from rubber products has exhibited significant increases and declines over the last 26 years. There has been an upward trend in GDP from rubber product manufacturing since 2006 (interrupted by declines and rebounds). In recent years, there have also been increases in real GDP from plastics manufacturers and non-metallic mineral product manufacturers (including concrete producers).
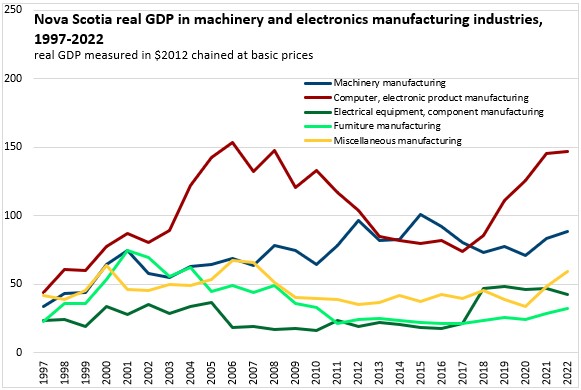
Nova Scotia's computer and electronic product manufacturers experienced declining real GDP from 2006-2017, but have rebounded in the years since then.
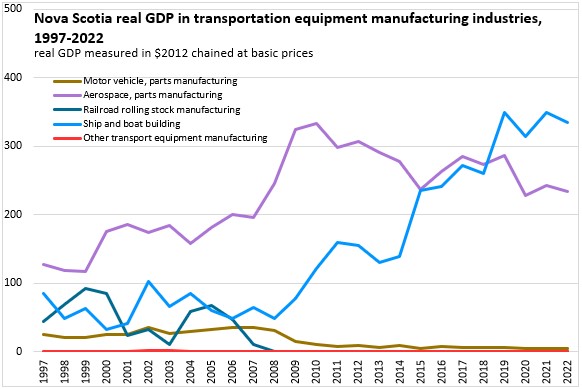
Nova Scotia's ship and boat building real GDP has grown substantially since 2008 while Nova Scotia's aerospace/parts producers have trended down since 2010.
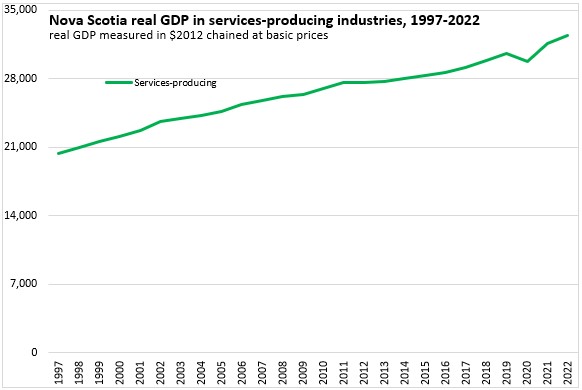
Real GDP from Nova Scotia's services-producing industries (including public sector) has risen steadily in most years with the exception of 2020.
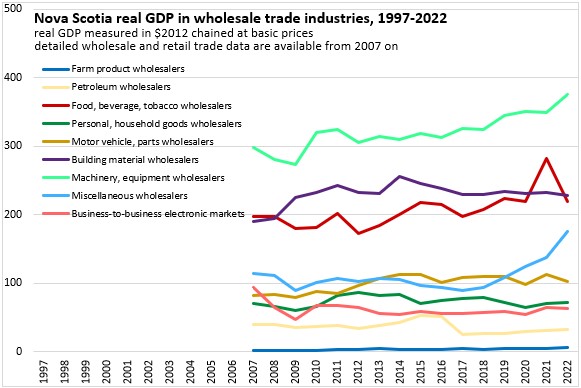
Within wholesale trade by industry (only available since 2007), real GDP has grown more rapidly in recent years for machinery/equipment wholesalers as well as miscellaneous wholesalers.
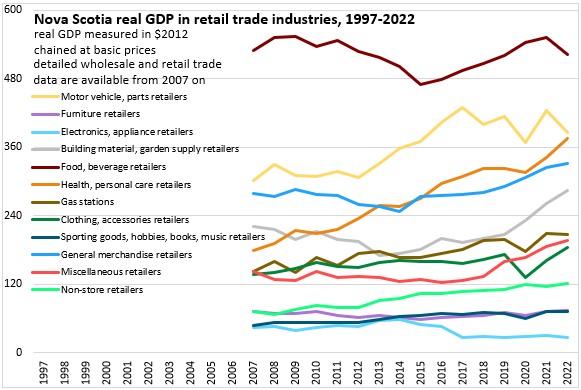
In detailed real GDP for retail trade, there has been faster growth recently for food/beverage stores (though this contracted in 2022), motor vehicles/parts dealers (up to 2017), health/personal care stores, electronics/appliance retailers and building material/garden supply centres.
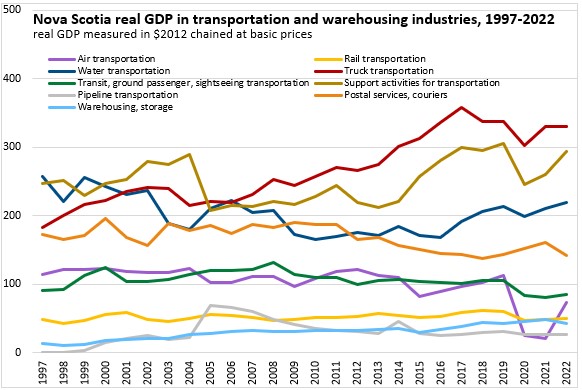
Transportation industries exhibited sharp declines during periods of pandemic-related restrictions (with the exception of postal/couriers and warehousing). This decline was particularly acute for air transportation and support activities for transportation. Real GDP from truck transportation rose substantially from 2004-2017 but has levelled off since then.
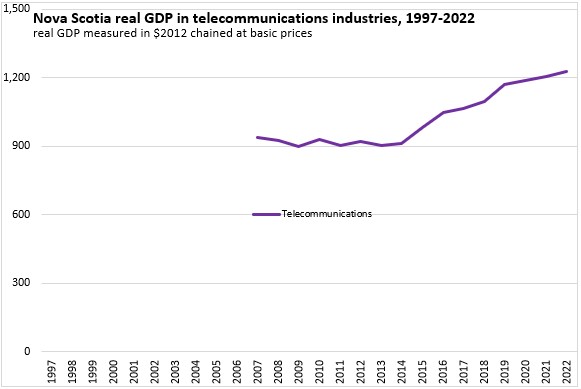
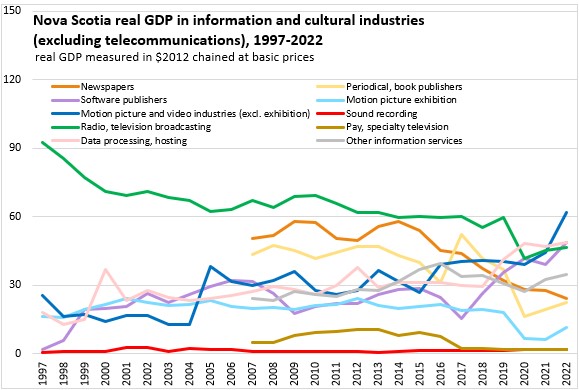
Telecommunications industries are by far the largest portion of Nova Scotia's information and cultural industries. There has been steady and substantial growth in Nova Scotia's telecommunications real GDP since 2014.
Among smaller industries in information and culture, there has been declining real GDP from radio/television broadcasting, newspapers and motion picture exhibition. There have been recent increases in real GDP from software publishers, data processing/hosting and motion picture and video industries outside of exhibition.
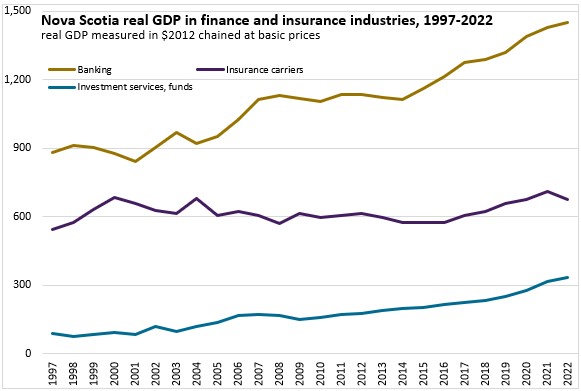
Real GDP from Nova Scotia banking and credit intermediation services has risen steadily since 2014. Real GDP from investment services and funds has growth since 2009. Real GDP from insurance carriers was flat from 2005-2017 before rising from 2018-2021 and declining in the last year.
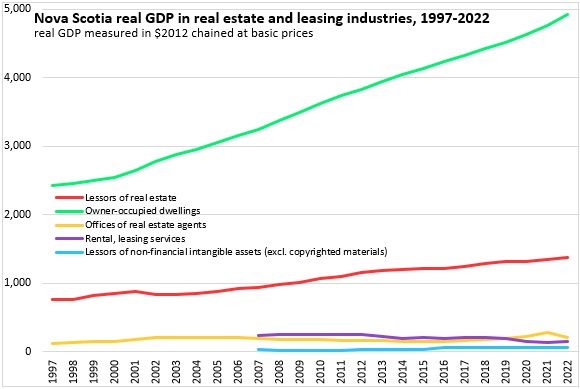
Real GDP by industry includes an imputed value for the real GDP generated by the housing services enjoyed by those who own the dwellings they occupy. This real GDP from owner-occupied dwellings has growth steadily and makes up the largest component of real GDP from real estate (even though it is never measured through an explicit housing services transaction). In contrast, the real GDP from leased real estate is measured explicitly and has also been rising steadily. Real GDP from real estate agents in Nova Scotia reported a spike in 2021.
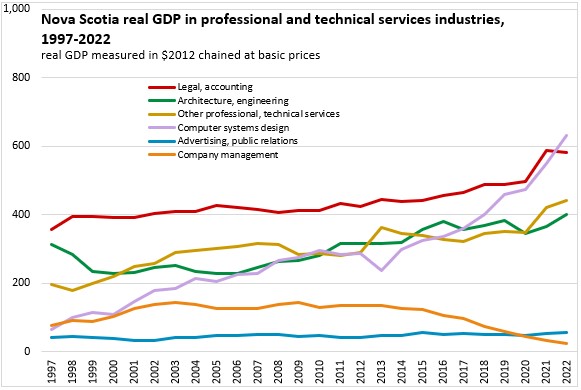
Professional and technical services in Nova Scotia accelerated during the pandemic, particularly for computer systems design. There have also been increases in real GDP for legal/accounting (except in 2022) and architecture/engineering. However, there have been steady declines in real GDP from company management in Nova Scotia (which is not categorized as part of professional/technical services).
After rising rapidly from 1998-2004, there has been a protracted decline in real GDP from "other administration support" industries, which includes call centres. There have been downward trends in real GDP from services to buildings/dwellings and travel arrangement services.
High-contact industries in arts/recreation and accommodation/food services exhibited the most severe contractions and rebounds during the COVID-19 pandemic. Neither traveller accommodations nor food services and drinking places had recovered to pre-pandemic levels of real GDP by 2022. Amusement and recreation services have returned to pre-pandemic levels of real GDP by 2022.
Among other services, there has been steady growth in real GDP from automotive repair. Like arts/recreation and accommodation/food, personal care services (such as hair care) reported a sharp decline and rebound in real GDP during the pandemic and have yet to recover to pre-pandemic levels.

Public sector real GDP increased steadily from 1997-2011 before contracting in the next two years and stabilizing through 2017. Since 2017, there has been a mostly steady rise in public sector real GDP in Nova Scotia, with the exception of 2020.
Nova Scotia's real GDP from education industries (which includes both public and private services), has increased largely on rising GDP from universities. Real GDP from elementary and secondary schools has been more stable. There was a notable contraction in real GDP from elementary and secondary schools in 2020, but this has rebounded beyond pre-pandemic levels in 2021 and 2022.

Real GDP from health care and social assistance (including both public and private industries) has been rising largely from hospitals and nursing/residential care facilities.
Within government services, there were notable declines in real GDP from Nova Scotia's defence services as well as the broader Federal government from 2011 through 2016 or 2017. Real GDP from provincial government services contracted from 2013 to 2017. Since 2017, real GDP from Federal government and defence services have risen faster than real GDP from other government services in Nova Scotia.

Source: Statistics Canada. Table 36-10-0402-01 Gross domestic product (GDP) at basic prices, by industry, provinces and territories (x 1,000,000)
<--- Return to Archive