The Economics and Statistics Division maintains archives of previous publications for accountability purposes, but makes no updates to keep these documents current with the latest data revisions from Statistics Canada. As a result, information in older documents may not be accurate. Please exercise caution when referring to older documents. For the latest information and historical data, please contact the individual listed to the right.
<--- Return to Archive
For additional information relating to this article, please contact:
June 14, 2023CANADA NATIONAL BALANCE SHEET ACCOUNTS, Q1 2023 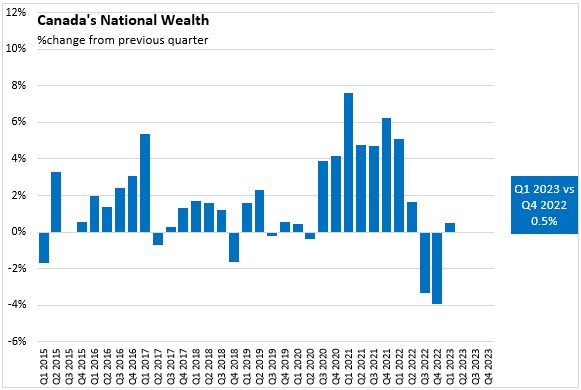

In the first quarter of 2023, Canadian national wealth (the total value of non-financial assets) increased by 0.5% to $16,005.2 billion. This follows a contraction of 3.9% in the fourth quarter of 2022 - the largest such decline since 2008. Residential real estate values rebounded after three consecutive quarters of decline, but falling commodity prices continued to erode the value of natural resource assets (excluding land).
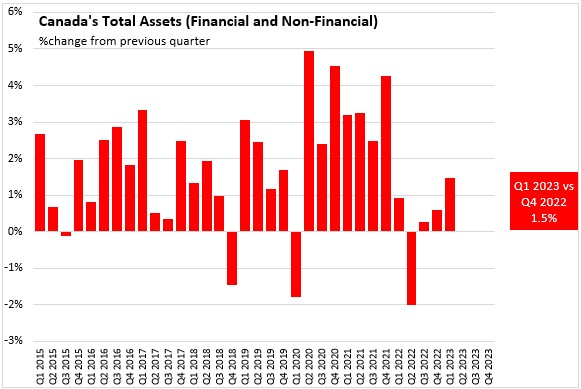
Total assets, including financial and non-financial assets increased by 1.5% to $60,159.8 billion at the end of Q1 2023, following a 0.6% increase in Q4 2022.
Household sector
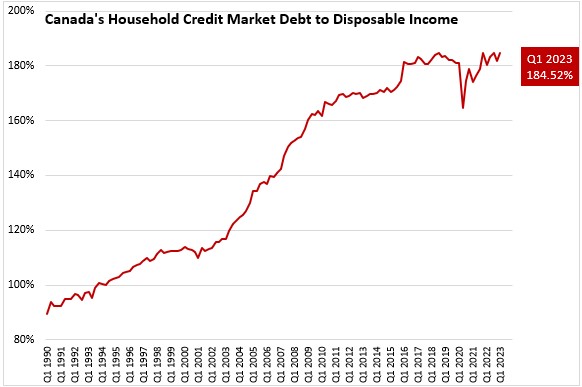
Household credit market debt as a proportion of household disposable income increased to 184.52% in Q1 2023.
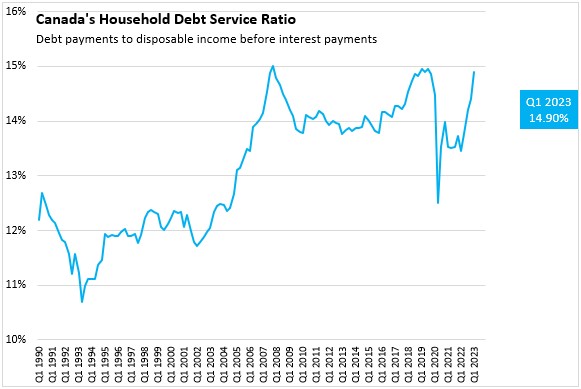
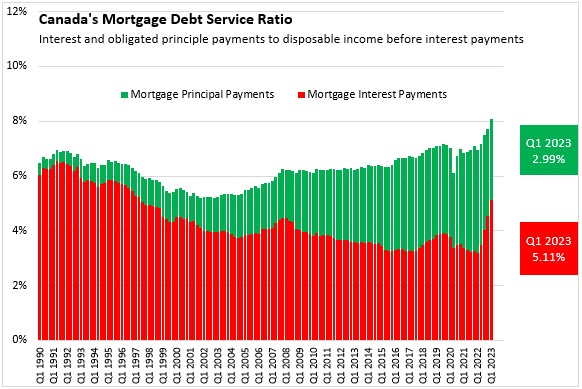
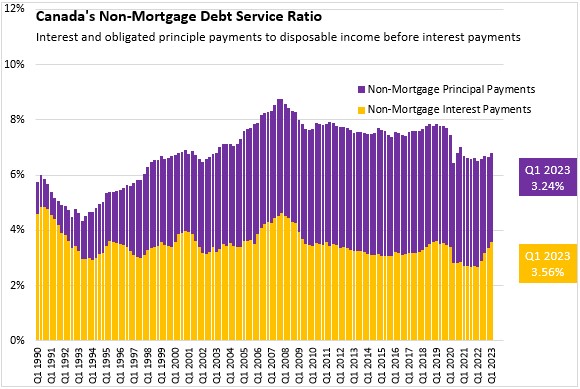
In Q1 2023, household debt payments rose to 14.90% of disposable income. Mortgage interest payments were up 58 basis points to 5.11% of disposable income, while non-mortgage interest payments rose 19 basis points to 3.56% of disposable income. Principle payments for both mortgages and non-mortgage loans contracted as a share of disposable income.
Government sector
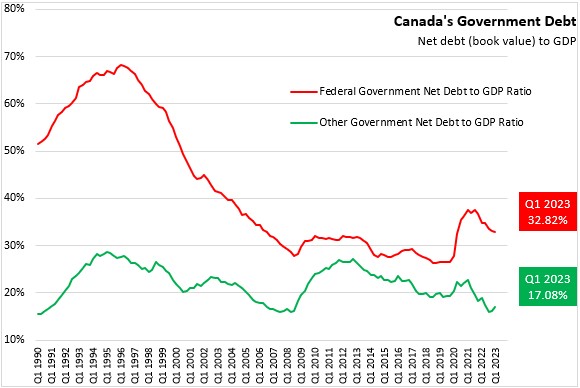
At the end of Q1 2023, federal government net debt (book value) declined again to 32.82% of GDP. Net debt of other levels of government increased to 17.08% of GDP.
Corporate sector
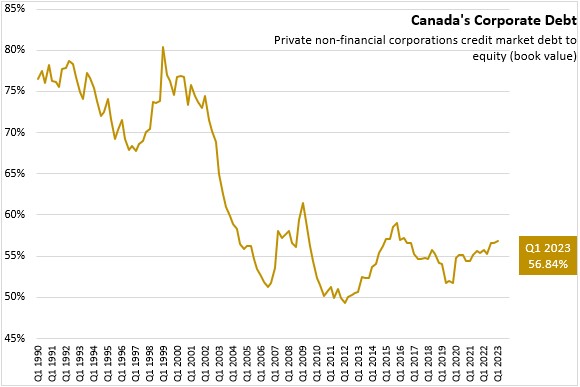
The credit market debt to equity ratio of non-financial private corporations rose to 56.84 cents of credit market debt for every dollar of equity in Q1 2023, up from 56.61 cents in Q4 2022.
Source: Statistics Canada. Table 11-10-0065-01 Debt service indicators of households, national balance sheet accounts; Table 36-10-0580-01 National Balance Sheet Accounts (x 1,000,000); Table 38-10-0235-01 Financial indicators of households and non-profit institutions serving households, national balance sheet accounts; Table 38-10-0236-01 Financial indicators of corporate sector, national balance sheet accounts; Table 38-10-0237-01 Financial indicators of general government sector, national balance sheet accounts; Table 38-10-0238-01 Household sector credit market summary table, seasonally adjusted estimates
<--- Return to Archive