The Economics and Statistics Division maintains archives of previous publications for accountability purposes, but makes no updates to keep these documents current with the latest data revisions from Statistics Canada. As a result, information in older documents may not be accurate. Please exercise caution when referring to older documents. For the latest information and historical data, please contact the individual listed to the right.
<--- Return to Archive
For additional information relating to this article, please contact:
July 04, 2023HOUSEHOLD INCOME, Q1 2023 Household Income
In addition to compensation of employees, household income also includes net mixed income (generated from unincorporated businesses), property income received (generated as the result of ownership of assets) and current transfers received (generally from government).
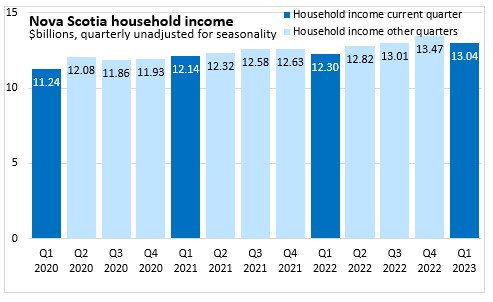
In Q1 2023, Nova Scotia's household income was $13.04 billion or $27,513 per household. Nova Scotia's income per household amounted to 77.8% of the national average per household. The highest income per household was in Alberta and lowest in Prince Edward Island.
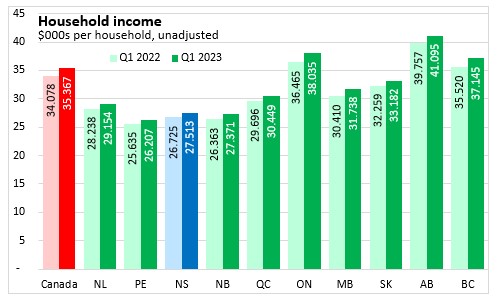
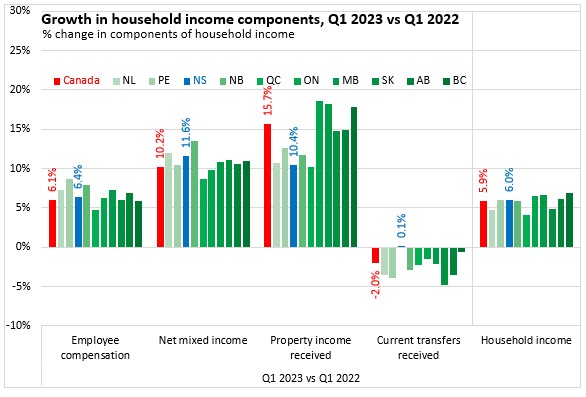
From Q1 2022 to Q1 2023, Nova Scotia's overall household income increased 6.0%. National household income growth was 5.9% with the fastest growth in British Columbia, Manitoba and Ontario. All ten provinces reported rising household income. Quebec reported the slowest household income growth among provinces.
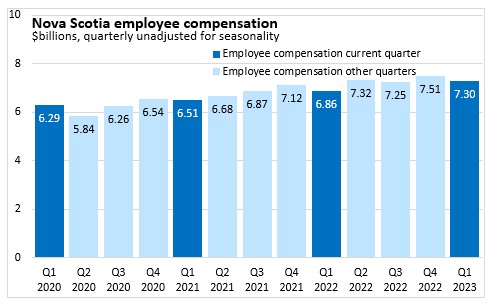
Nova Scotia's employee compensation was $7.30 billion in Q1 2023 or $15,410 per household (71.5% of the national average per household). Across Canada, employee compensation per household was $21,557. Alberta reported the highest employee compensation per household and Prince Edward Island the lowest.
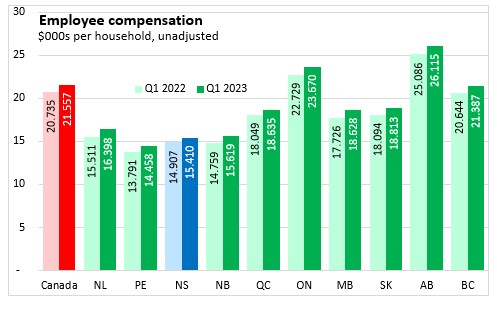
Nova Scotia's overall employee compensation was up 6.4% from Q1 2023 to Q1 2023. National employee compensation increased 6.1% with the fastest pace in Prince Edward Island (+8.7%) and the slowest in Quebec (+4.8%).
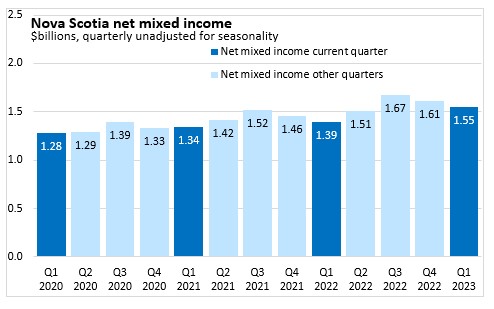
Net mixed income generated by unincorporated businesses amounted to $1.55 billion or $3,278 per household (93.8% of the national average per household). Across Canada, average per household net mixed income was $3,493 with the highest values in British Columbia and the lowest in Quebec.
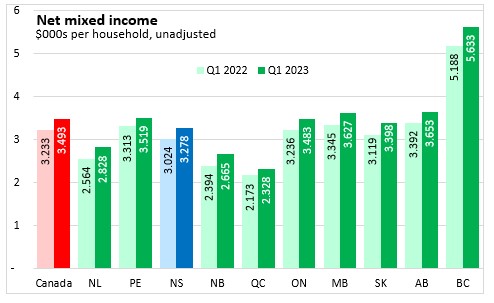
From Q1 2022 to Q1 2023, Nova Scotia's net mixed income grew by 11.6%, above the national growth rate of 10.2% over the same period.
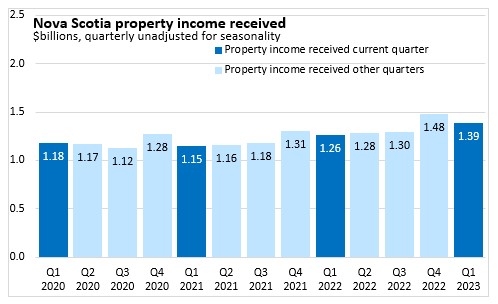
Nova Scotia property income received in Q1 2023 was $1.39 billion or $2,935 per household (74.1% of the national average). National property income per household was $3,962 with the highest values in Alberta and the lowest values in Newfoundland and Labrador.
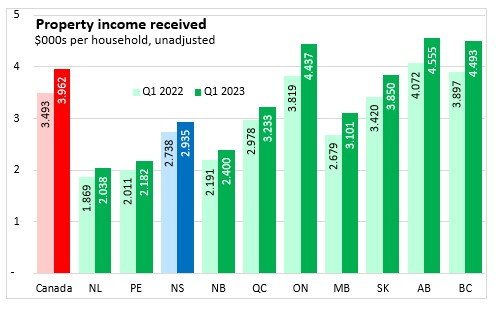
From Q1 2022 to Q1 2023, property income receipts increased by 10.4% in Nova Scotia - slower than the national pace of 15.7%.
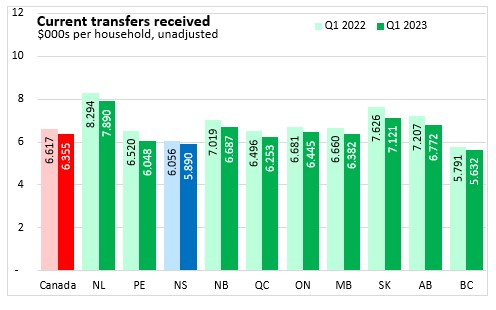
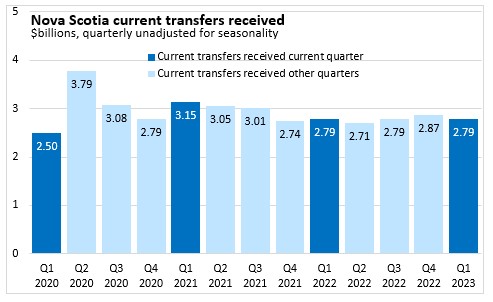
Current transfers received in Nova Scotia were up to $2.79 billion or $5,890 per household in Q1 2023. Current transfers received in Nova Scotia were 92.7% of the national average per household ($6,355). Transfers per household were highest in Newfoundland and Labrador and lowest in British Columbia.
Compared with Q1 2022, the most recent quarterly transfer income received in Nova Scotia was up 0.1%. Nationally, current transfer income receieved declined 2.0% from the same period last year.
Source: Statistics Canada. Table 36-10-0663-01 Distributions of household economic accounts, income, consumption and saving, Canada, provinces and territories, quarterly (x 1,000,000)
<--- Return to Archive