The Economics and Statistics Division maintains archives of previous publications for accountability purposes, but makes no updates to keep these documents current with the latest data revisions from Statistics Canada. As a result, information in older documents may not be accurate. Please exercise caution when referring to older documents. For the latest information and historical data, please contact the individual listed to the right.
<--- Return to Archive
For additional information relating to this article, please contact:
August 04, 2023LABOUR MARKET TRENDS, JULY 2023 July labour force survey results reflect the period from July 9 to 15, 2023.
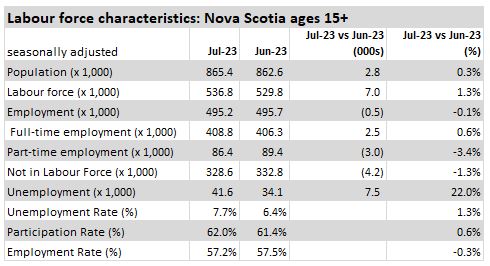
Ages 15+ (July 2023 vs June 2023, seasonally adjusted)
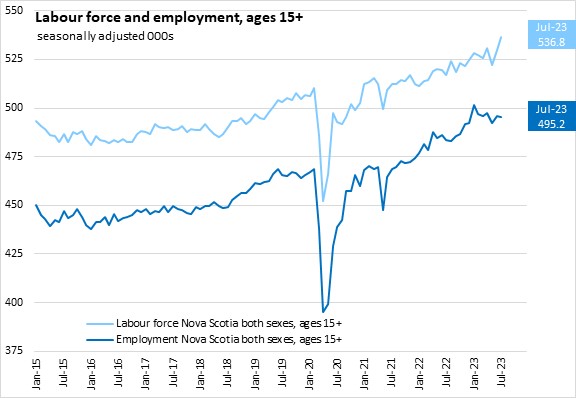
Nova Scotia's seasonally adjusted employment decreased 500 (-0.1%) to 495,200 in July 2023, following a employment gain the previous month.
The change in employment was attributable to an increase in full-time employment (+2,500) and a larger decrease in part-time employment (-3,000). Note that changes in full-time and part-time employment can also reflect changing hours for the same job.
Nova Scotia’s labour force increased by 7,000 (+1.3%) to 536,800 in July 2023. This is an all-time high for the size of the labour force.
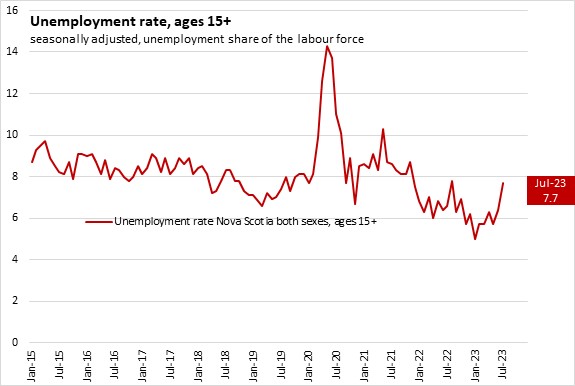
With large labour force increase and the employment decline, Nova Scotia's unemployment rate was up 1.3 percentage points to 7.7% in July 2023. This was the highest unemployment rate since August 2022.
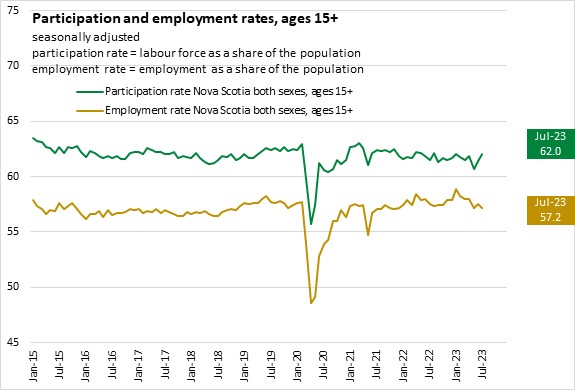
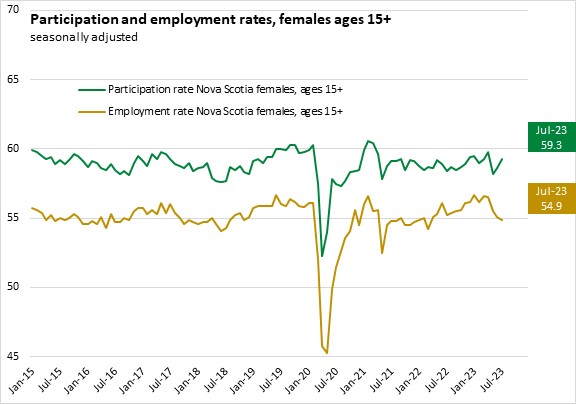
Nova Scotia's labour force participation rate was up 0.6 percentage points to 62.0% in July 2023. The employment rate was down 0.3 percentage points to 57.2% in July 2023.
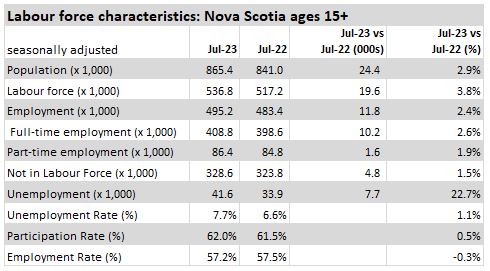
Ages 15+ (July 2023 vs July 2022, seasonally adjusted)
Compared with July 2022, Nova Scotia's population over the age of 15 had increased by 24,400 (+2.9%) while the labour force grew by 19,600 (+3.8%) and employment increased by 11,800 (+2.4%). The unemployment rate was up 1.1 percentage points with the participation rate up 0.5 percentage points and the employment rate down 0.3 percentage points.
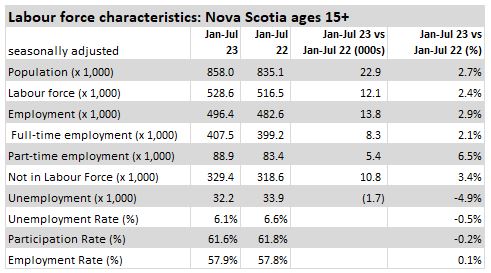
Ages 15+ (January-July 2023 vs January-July 2022, seasonally adjusted)
Compared with January-July of 2022, Nova Scotia's population over the age of 15 had increased by 22,900 (+2.7%) while the labour force grew by 12,100 (+2.4%) and employment increased by 13,800 (+2.9%). The unemployment rate decreased by 0.5 percentage points with the participation rate down 0.2 percentage points and the employment rate up 0.1 percentage points.
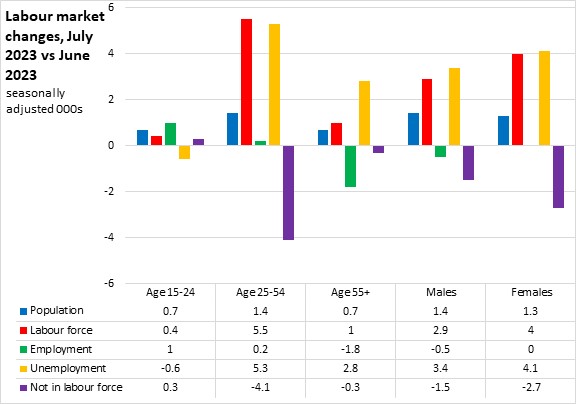
Age Cohorts (July 2023 vs June 2023, seasonally adjusted)
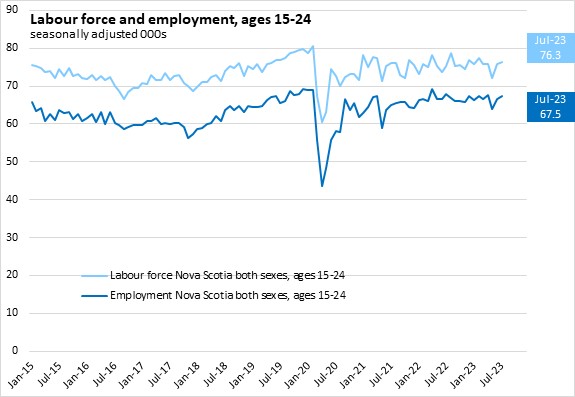
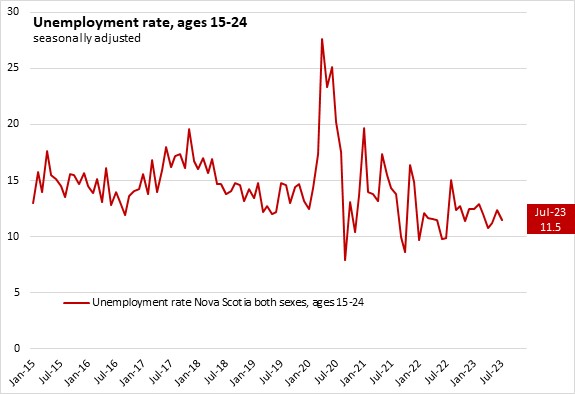
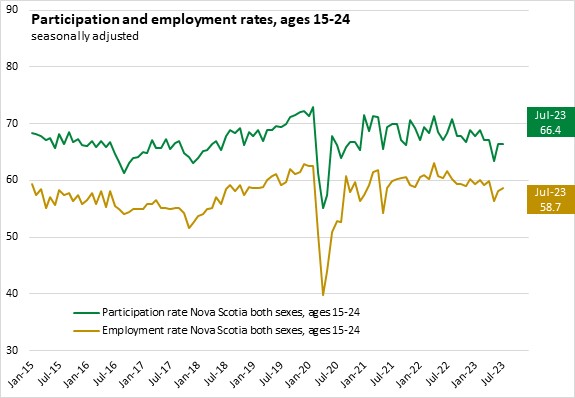
Among youth (ages 15-24), employment increased by 1,000 (+1.5%) and the labour force increased 400 (+0.5%). With a larger increase in employment than the labour force, the youth unemployment rate was down 0.9 percentage points to 11.5% in July. The youth participation rate was down 0.1 percentage points to 66.4% and the youth employment rate was up 0.5 percentage points to 58.7%.
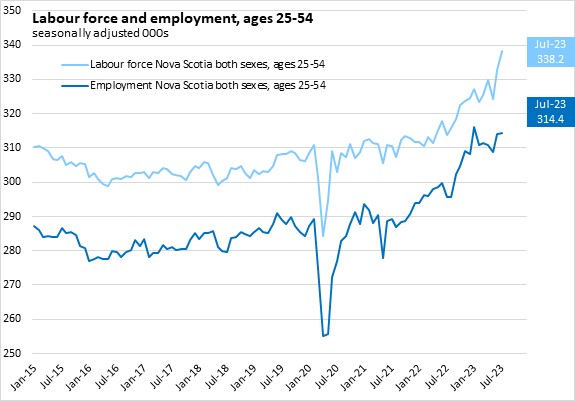
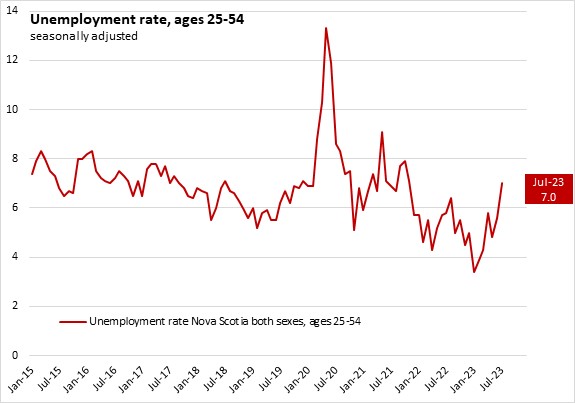
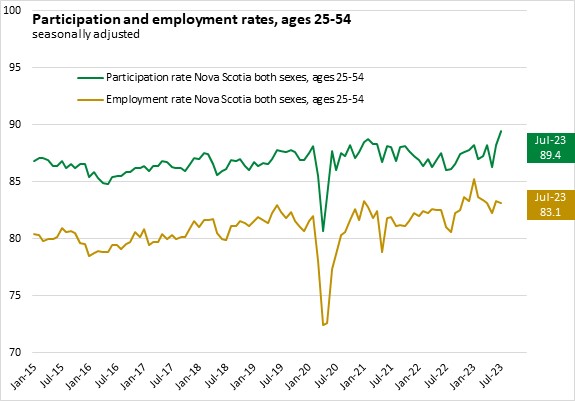
The population aged 25-54 makes up the largest part of the labour force. In the core age group, employment was up by 200 (+0.1%) while the labour force increased by 5,500 (+1.7%). Because employment increased less than the labour force, the core aged unemployment rate was up 1.4 percentage points to 7.0% in July 2023. The core aged participation rate increased 1.2 percentage points to 89.4% while the core aged employment rate decreased 0.2 percentage points to 83.1%.
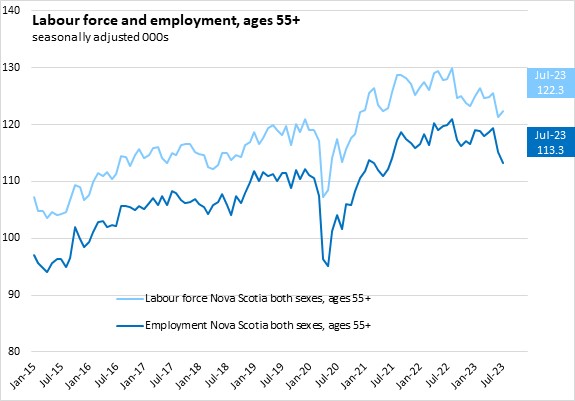
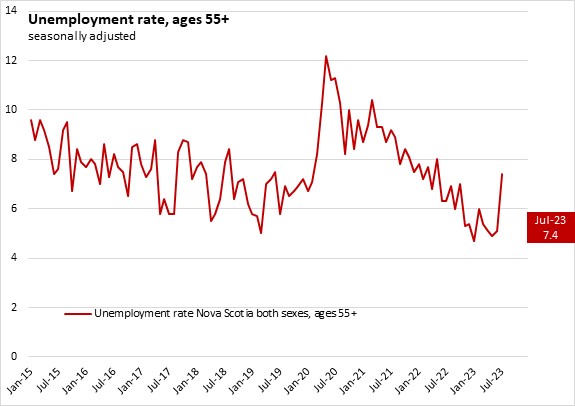
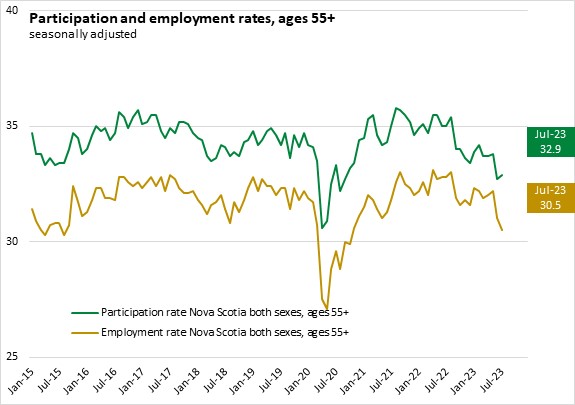
Older workers (aged 55+) reported an increase in labour force (+1,000 or +0.8%) while employment declined (-1,800 or -1.6%). With labour force rising while employment declined, the older worker unemployment rate increased 2.3 percentage points to 7.4%. The older worker participation rate was up 0.2 percentage points to 32.9% and the employment rate for older workers was down 0.5 percentage points to 30.5%.
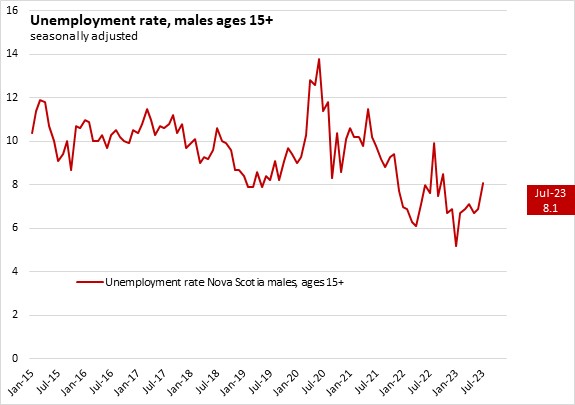
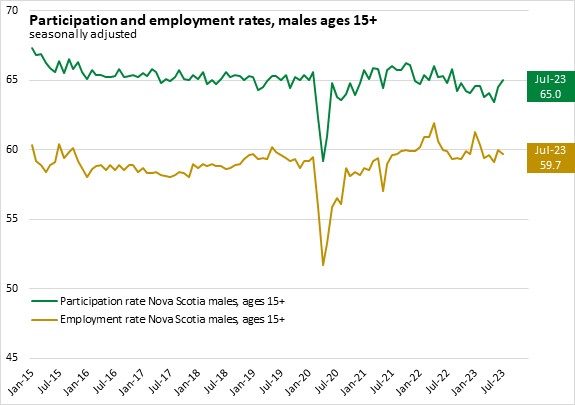
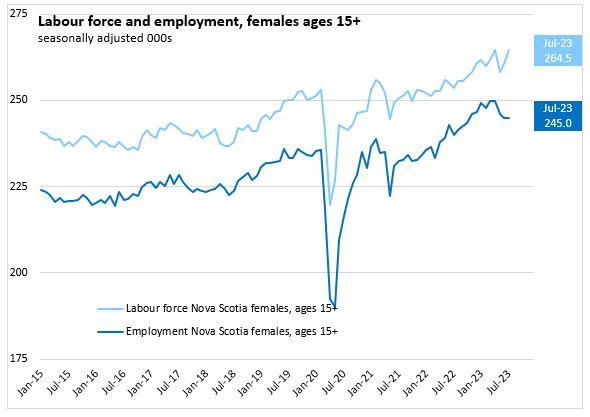
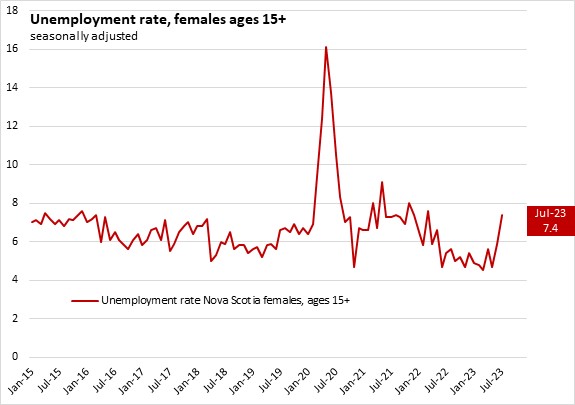
Males and Females (Ages 15+, July 2023 vs June 2023, seasonally adjusted)
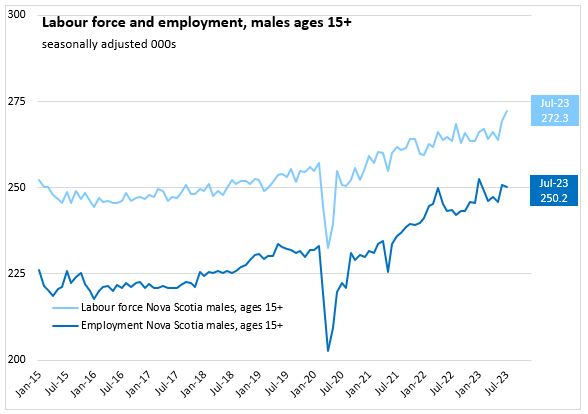
Monthly employment decreased by 500 (-0.2%) for males while the labour force increased 2,900 (+1.1%). With an increase in labour force and lower employment, the male unemployment rate increased 1.2 percentage points to 8.1% in July. The male participation rate was up 0.5 percentage points to 65.0% and the male employment rate was down 0.3 percentage points to 59.7%.
Females reported no change in employment while the labour force increased (+4,000 or +1.5%) With the labour force increasing and employment being steady, the female unemployment rate increased 1.5 percentage point to 7.4% in July. Female participation rates were up 0.7 percentage points to 59.3% and the female employment rate was down 0.2 percentage points to 54.9%.
Overall, last month's labour force increase was largely in core-aged workers and larger for females than males. Employment decreases were among males and those aged 55 and over.
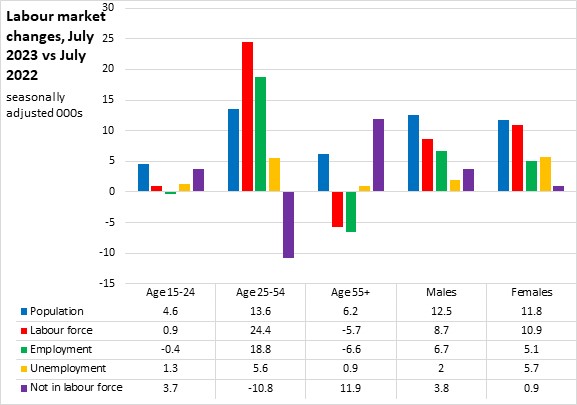
Age and sex cohorts (July 2023 vs July 2022, seasonally adjusted)
Compared with July 2022, labour force and employment growth was concentrated among core aged workers (whose population is also growing more than others). Youth (15-24) population and labour force grew while employment was nearly unchanged. The older population (55+) had an increase in population but declines in labour force and employment. Male employment has increased more than females even as there were similar rises in population.
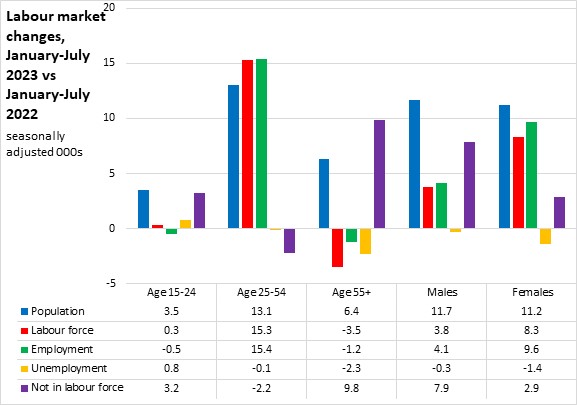
Age and sex cohorts (January-July 2023 vs January-July 2022, seasonally adjusted)
Comparing the first seven months of 2023 with same months last year, labour force and employment gains are mostly among core aged workers. Youth labour force and employment had small changes. Among older workers, there has been an increase in persons not in labour force (typically including retired persons) and declines in labour force, employment and unemployment. Although there were similar population increases, the labour force and employment among females has increased more than among males.
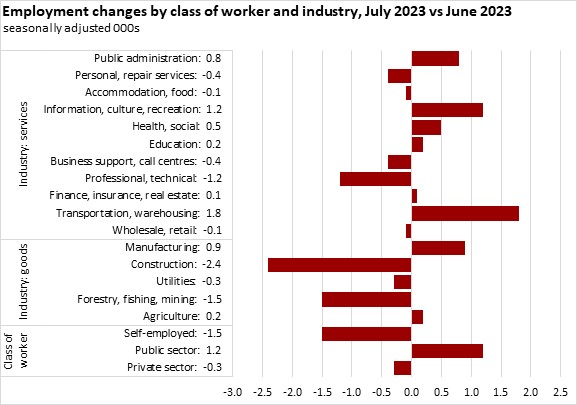
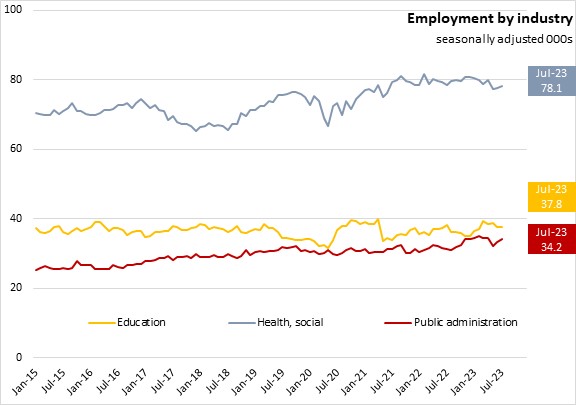
Class of Worker and Industry (July 2023 vs June 2023, seasonally adjusted)
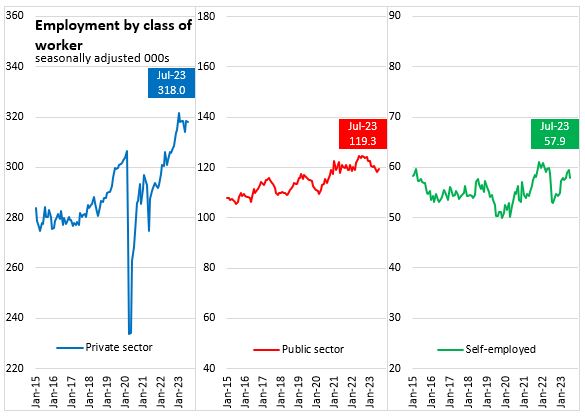
The July 2023 employment change reflected decrease in private sector workers (-300 or -0.1%) and self-employed (-1.5 or -2.5%) while public sector increased (1,200 or +1.0%).
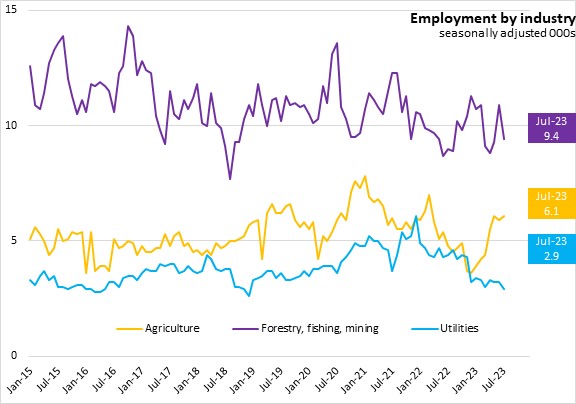
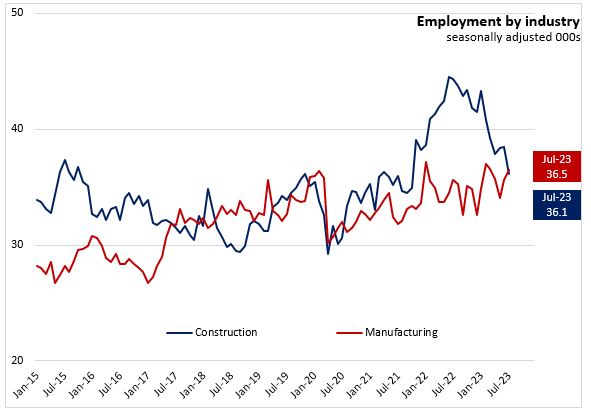
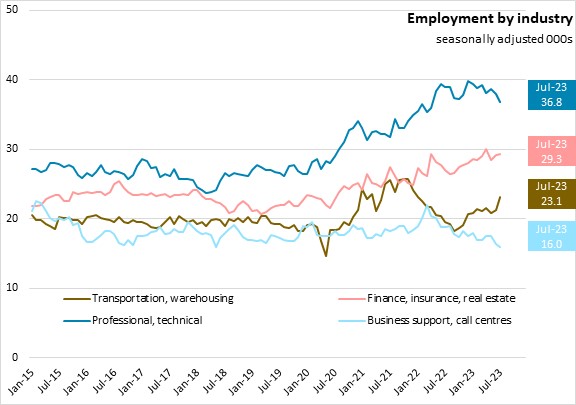
Classified by industry, the employment change from June to July reflected the largest decreases in construction; forestry, fishing, and mining; and professional/technical services with largest increases among transportation/warehousing; information, cultural, recreation; and manufacturing.
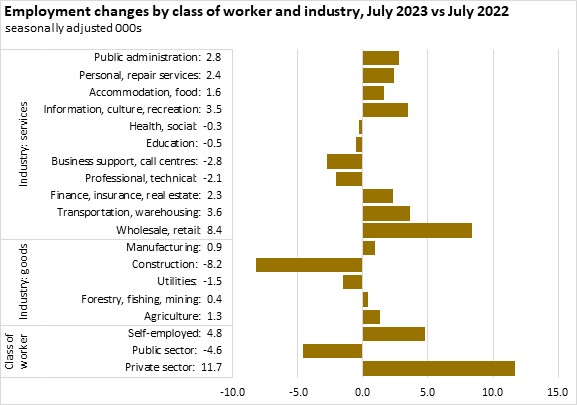
Class of Worker and Industry (July 2023 vs July 2022, seasonally adjusted)
Compared to July 2022, there was a large gain in employment for private sector workers (+11,700 or +3.8%) and self-employed (+4,800 or 9.0%). Public sector workers declined over the past year (-4,600 or -3.7%).
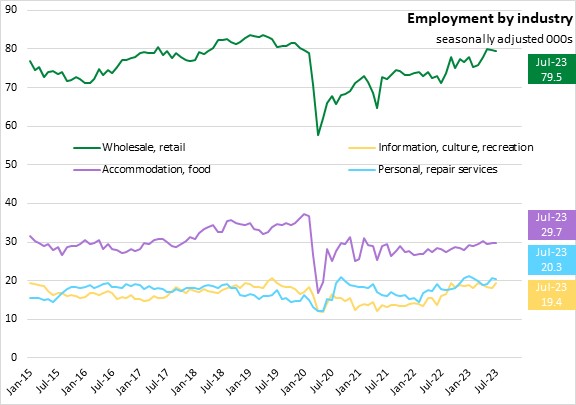
Over the last 12 months, employment by industry has risen most for wholesale/retail, transportation/warehousing, and information/culture/recreation. There were notable employment losses in construction, business support services, professional/technical services and utilities.
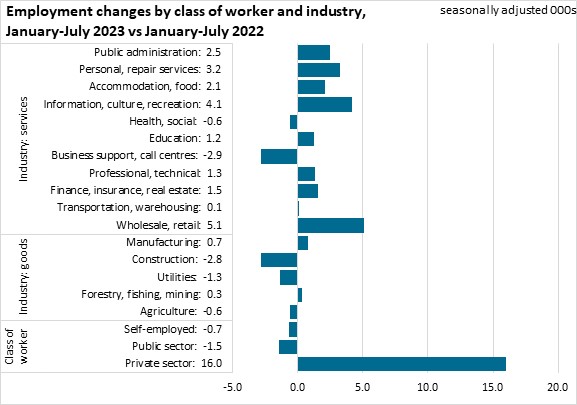
Class of Worker and Industry (January-July 2023 vs January-July 2022, seasonally adjusted)
The average employment levels for January-July 2023 compared to January-July 2022 increased for private sector (+16,000 or +5.3%), was down for public sector (-1,500 or -1.2%) and self-employed (-700 or -1.2%). The first seven months average employment had the most notable gains in wholesale/retail, information/culture/recreation, personal/repair, public administration, and accommodation/food services. Lower employment was notably in business support services, construction, and utilities.
Hours worked and employment (July 2023, unadjusted)
A larger share of workers in construction, transportation/warehousing, utilities manufacturing, and forestry/fishing/mining worked more than 40 hours per week in July 2023.
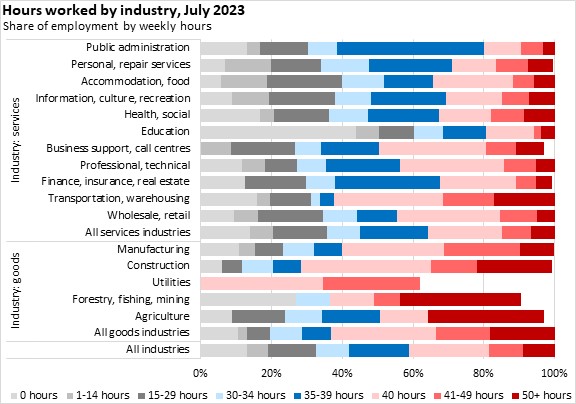
Note that some data on those working few hours in utilities, forestry, fishing, and mining and agriculture were suppressed.
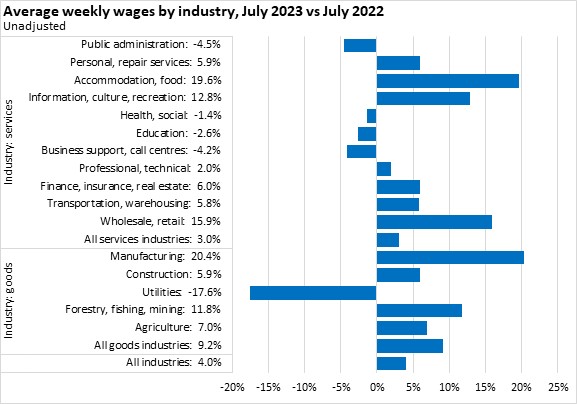
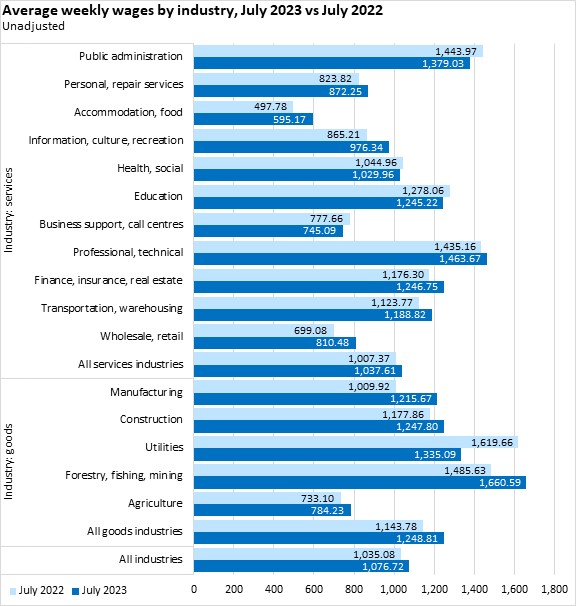
Average weekly earnings (unadjusted, both full time and part time, July 2023 vs July 2022)
Average weekly earnings increased by 4.0% from July 2022 to July 2023. The fastest gains in average weekly earnings were in manufacturing, accommodation/food service, wholesale/retail, information/culture/recreation and forestry/fishing/mining. Average weekly wages had larger declines in utilities, public administration, and business support/call centres.
The increase in Nova Scotia's all items consumer price index was 1.9% from June 2022 to June 2023.
Average weekly earnings across all employees were $1,076.72 in July 2023. The highest average weekly earnings (both full and part time employees) were reported in forestry/fishing/mining, professional/technical services, public administration and utilities. The lowest average weekly earnings were in accommodation/food services, business support services, wholesale/retail trade, and personal/repair services.
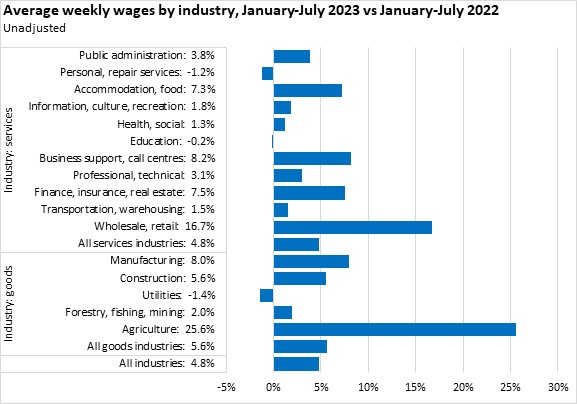
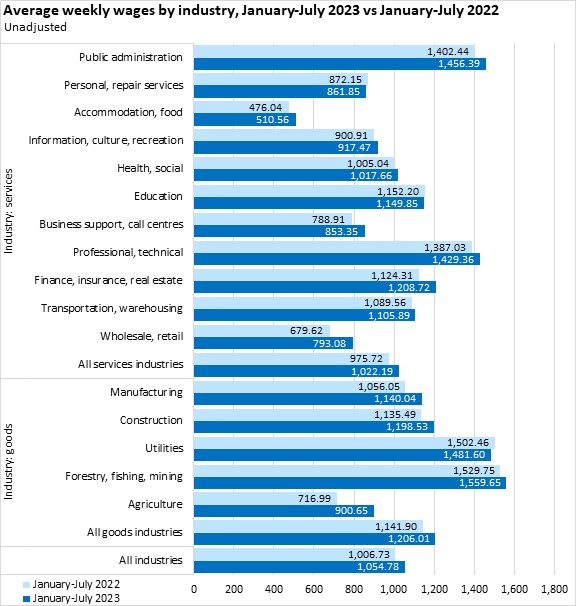
Average weekly earnings (unadjusted, both full time and part time, January-July 2023 vs January-July 2022)
Average weekly earnings for the first seven months of the year were 4.8% higher than the same months last year. Agriculture, wholesale/retail, business support/call centres, manufacturing and finance/insurance/real estate reported the fastest growth. Average wages in personal/repair services, utilities, and educational services reported a decline.
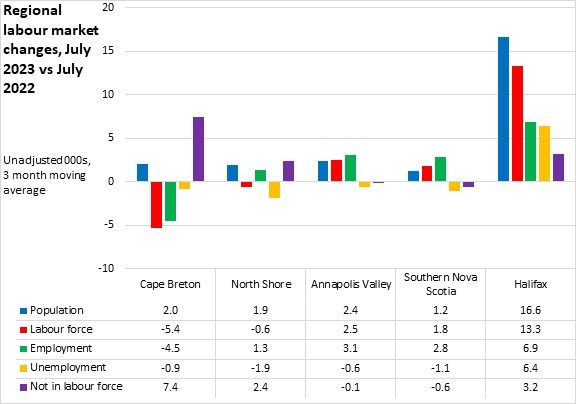
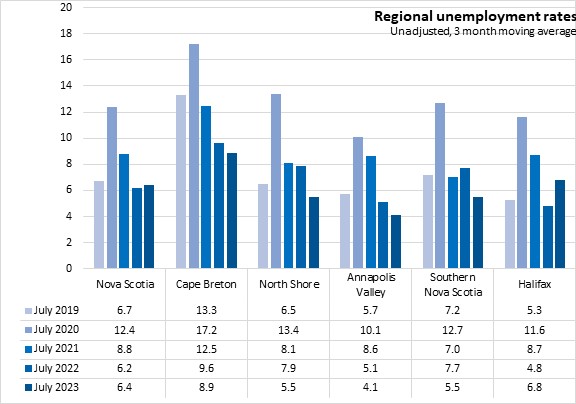
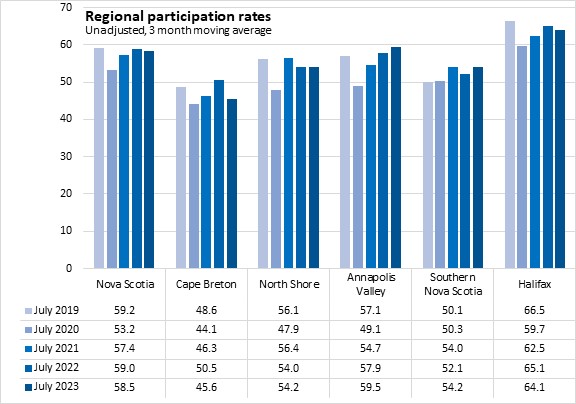
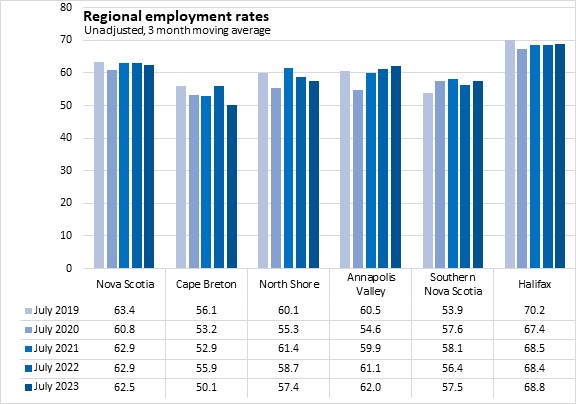
Regions (July 2023 vs July 2022, unadjusted 3 month moving average)
Compared with July 2022, the labour force and employment increase was concentrated in Halifax. Annapolis Valley and Southern also reported increase in both labour force and employment compared to July 2022. North Shore had a small decline in labour force while employment grew. Cape Breton labour force and employment were down compared to last year.
Unemployment rates declined for all regions except Halifax. The participation rate increased for North Shore, Annapolis Valley and Southern region. The employment rate was up in Annapolis Valley, Southern and Halifax. The declines in the participation rate and employment rate in Cape Breton were larger than other regions.
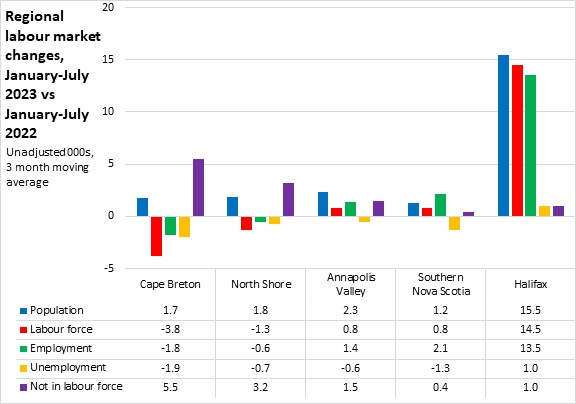
Regions (January-July 2023 vs January-July 2022, unadjusted 3 month moving average)
For the first seven months of 2023, Cape Breton and North Shore had declines in both labour force and employment. Increases in employment and labour force were concentrated in Halifax. Employment was up more than the labour force in Annapolis Valley and Southern compared to January-July 2022.
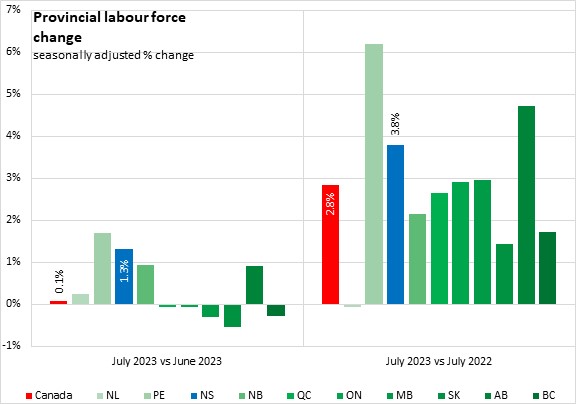
Provincial Comparisons (seasonally adjusted)
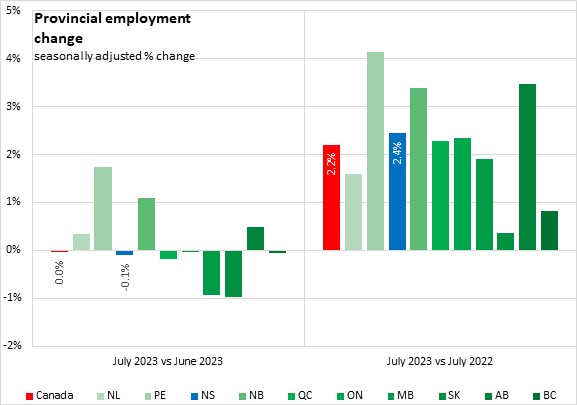
Canada's labour force grew by 0.1% from June to July while Nova Scotia's labour force was up 1.3%. The largest increase among the provinces was in Prince Edward Island reported while Alberta reported the largest declines over the last month.
Compared with July 2022, national labour force was up 2.8% (+3.8% in Nova Scotia). The fastest increase was in Prince Edward Island, Alberta, and Nova Scotia. Newfoundland and Labrador reported the only decline.
Canada's employment was little changed with only a 6000 (-0.0%) from June to July. Prince Edward Island reported the largest gain while declines were largest in Alberta and Saskatchewan. Compared with July 2022, Nova Scotia's employment was up 2.4% in July 2023, faster than the national gain of 2.2%. The largest increases were in Prince Edward island and Alberta while the slowest growth was in Saskatchewan.
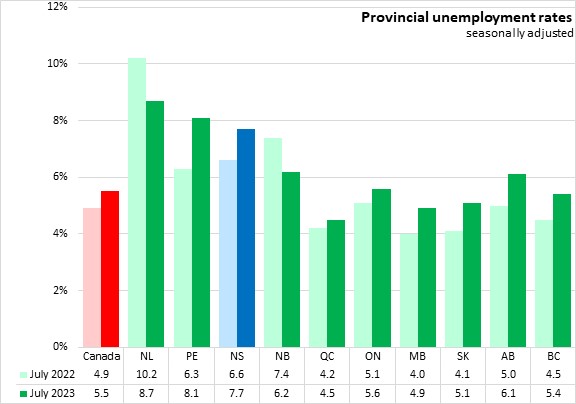
The national unemployment rate was 5.5% in July 2023, up from 5.4% in June 2023 and up from 4.9% in July 2022. Quebec had the lowest unemployment rate while Newfoundland and Labrador reported the highest unemployment rate.
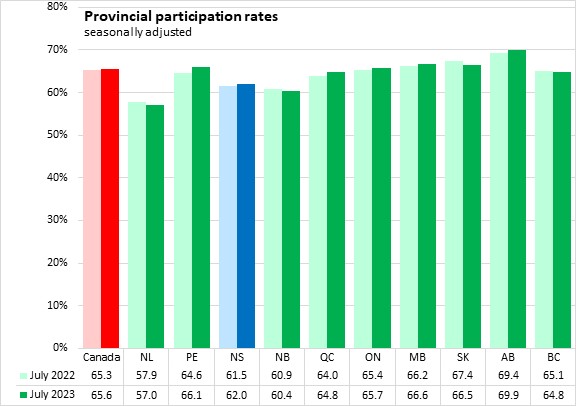
The national participation rate was 65.6% in July 2023. The highest participation rate was in Alberta while the lowest was in Newfoundland and Labrador.
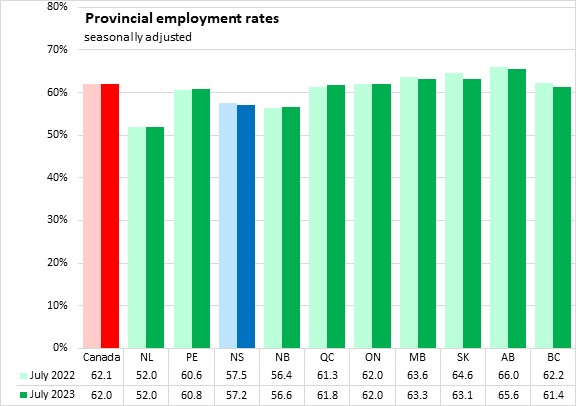
The national employment rate was 62.0% in July 2023. Alberta reported the highest employment rate while Newfoundland and Labrador reported the lowest.
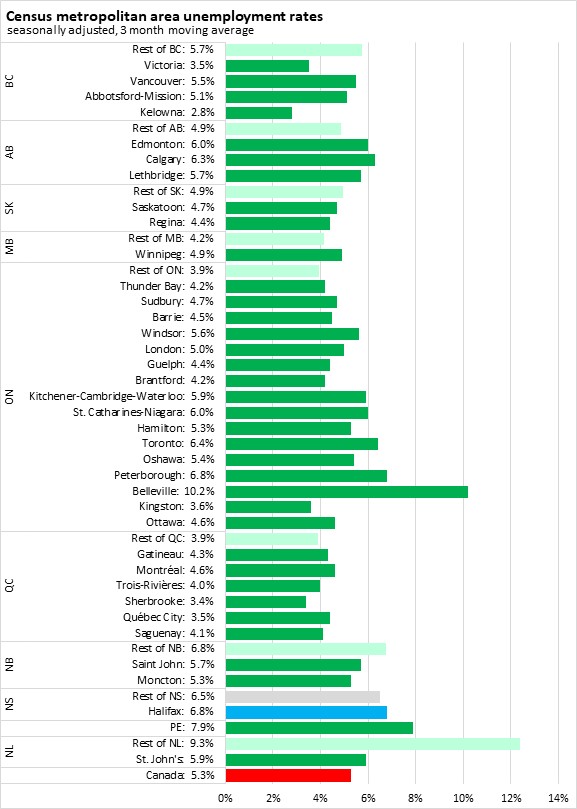
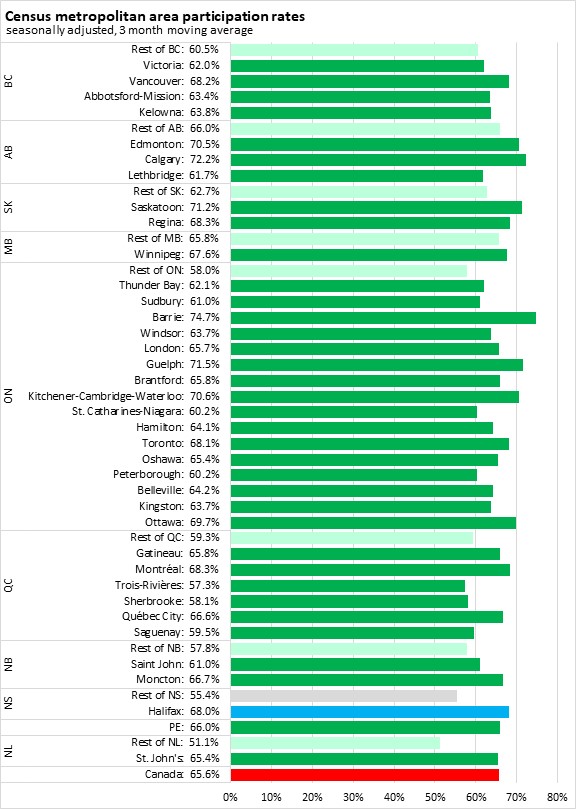
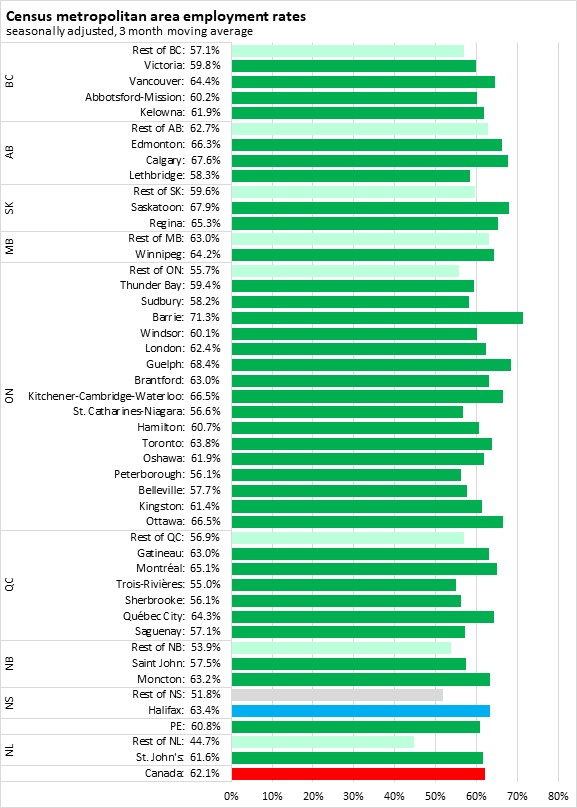
Census Metropolitan Areas (July 2023, seasonally adjusted 3 month moving average)
The Halifax unemployment rate was 6.8% in the seasonally adjusted July 2023 three month moving average. While outside of Halifax the unemployment rate was 6.5%, reversing the more typical pattern of lower unemployment rate in Halifax. In central and western provinces, unemployment rates in Census Metropolitan Areas are similar to or higher than unemployment rates outside CMAs. In the Atlantic Provinces unemployment rates are typically higher outside CMAs.
Halifax's participation rate was 68.0% in the seasonally adjusted July 2023 three month moving average while participation rates were 55.4% across the rest of the province.
Halifax reported an employment rate of 63.4% in the seasonally adjusted July 2023 three month moving average while the employment rate was 51.8% outside the city.
Sources: Statistics Canada. Table 14-10-0036-01 Actual hours worked by industry, monthly, unadjusted for seasonality; Table 14-10-0063-01 Employee wages by industry, monthly, unadjusted for seasonality; Table 14-10-0287-01 Labour force characteristics, monthly, seasonally adjusted and trend-cycle, last 5 months; Table 14-10-0380-01 Labour force characteristics, three-month moving average, seasonally adjusted; Table 14-10-0387-01 Labour force characteristics, three-month moving average, unadjusted for seasonality, last 5 months; Table 14-10-0355-01 Employment by industry, monthly, seasonally adjusted and unadjusted, and trend-cycle, last 5 months (x 1,000); Table 14-10-0288-01 Employment by class of worker, monthly, seasonally adjusted and unadjusted, last 5 months (x 1,000); Table: 14-10-0380-02 Labour force characteristics, three month moving average, seasonally adjusted (x 1,000)
<--- Return to Archive