The Economics and Statistics Division maintains archives of previous publications for accountability purposes, but makes no updates to keep these documents current with the latest data revisions from Statistics Canada. As a result, information in older documents may not be accurate. Please exercise caution when referring to older documents. For the latest information and historical data, please contact the individual listed to the right.
<--- Return to Archive
For additional information relating to this article, please contact:
August 31, 2023US PERSONAL INCOME AND OUTLAY, JULY 2023 Month over month (July 2023 vs June 2023, seasonally adjusted)
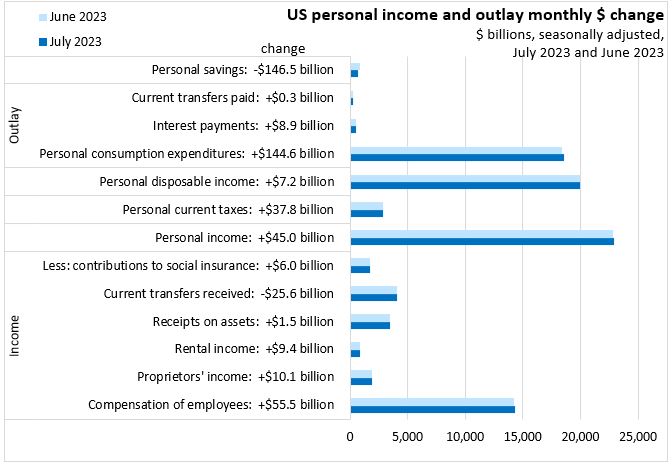
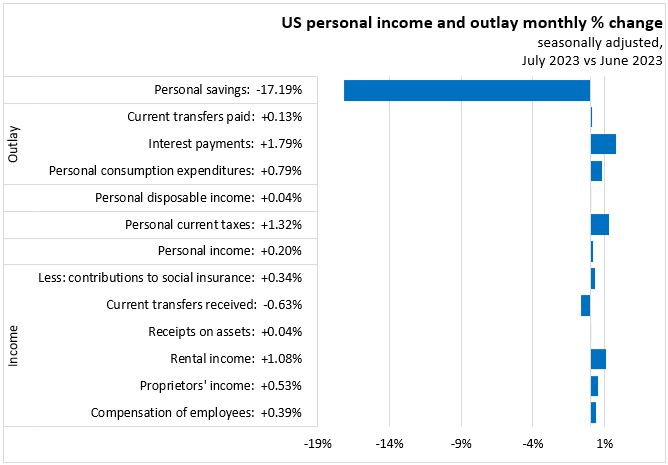
The US Bureau of Economic Analysis reported that US personal income increased by $45.0 billion (+0.20%) from June to July. Employee compensation was up $55.5 billion (+0.39%). Personal disposable income was up $7.2 billion (+0.04%) while personal consumption expenditures (PCE) grew by $144.6 billion (+0.79%).
US personal savings declined by $146.5 billion (-17.19%) in July for the second consecutive month.
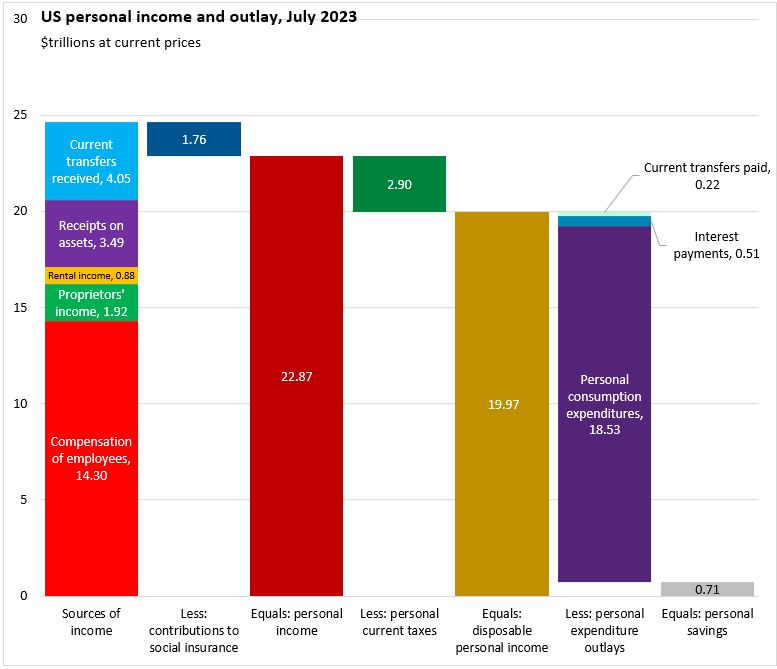
US personal income is calculated as the sum of employee compensation ($14.30 trillion), proprietors' income ($1.92 trillion), rental income ($0.88 trillion), receipts on assets ($3.49 trillion) and current transfers received ($4.05 trillion), less contributions to social insurance programs ($1.76 trillion). Personal income ($22.87 trillion) less personal current taxes ($2.90 trillion) equals disposable income ($19.97 trillion).
The outlay of US personal disposable income consists of personal consumption expenditures ($18.53 trillion), interest payments ($0.51 trillion) and current transfers paid ($0.22 trillion) with personal savings ($0.71 trillion) accounting for the remaining amount.
Trends
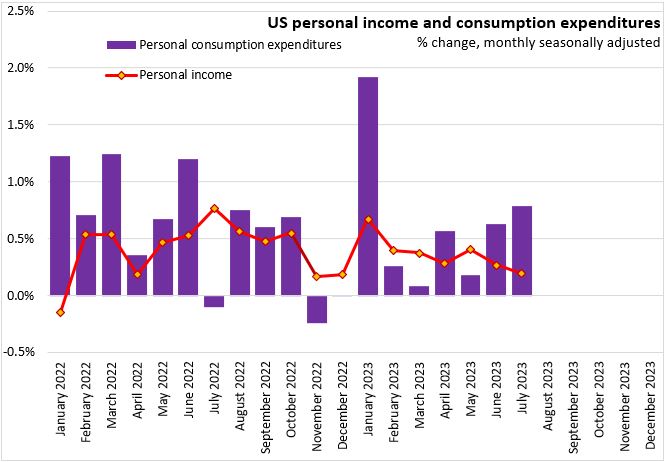
In June, US personal consumption expenditures outpaced growth in personal income for the fourth time this year.
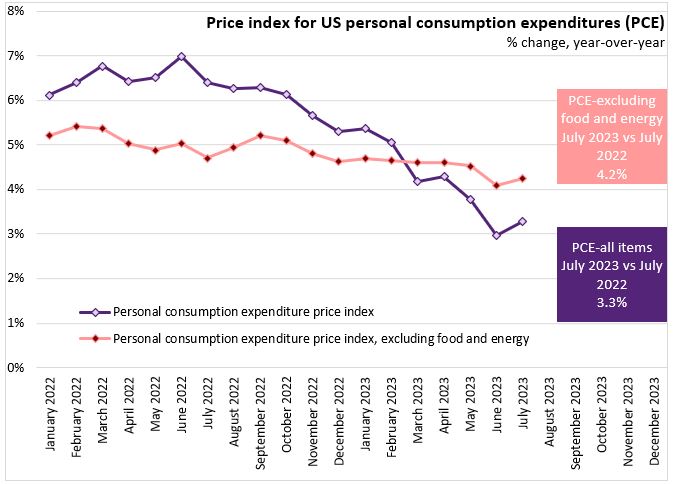
Growth in the price index for personal consumption expenditures rose to +3.3% year-over-year in July. Year-over-year growth in the price index for all items excluding food and energy rose to 4.2%, but outpaced all items PCE inflation for the fifth consecutive month.
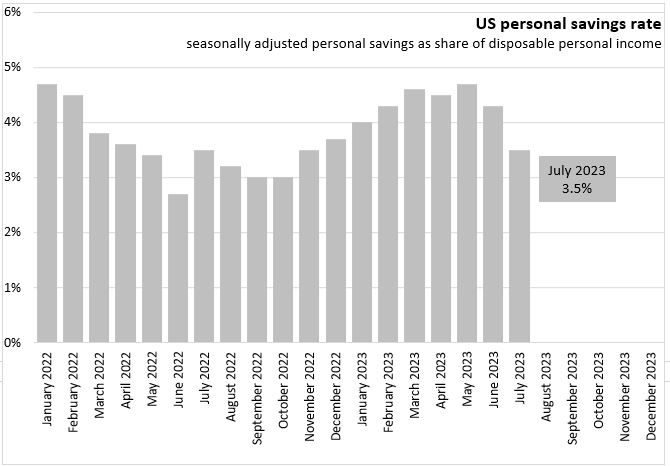
With growth in consumption expenditures outpacing income growth the US personal savings rate fell to 3.5% of disposable personal income.
Year-to-date (January-July 2023 vs January-July 2022)
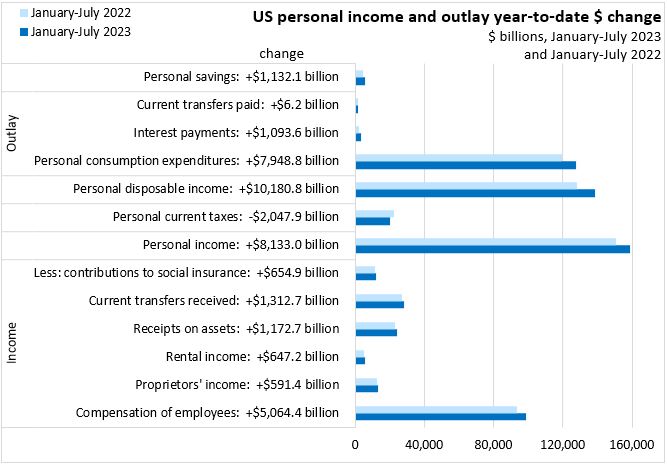
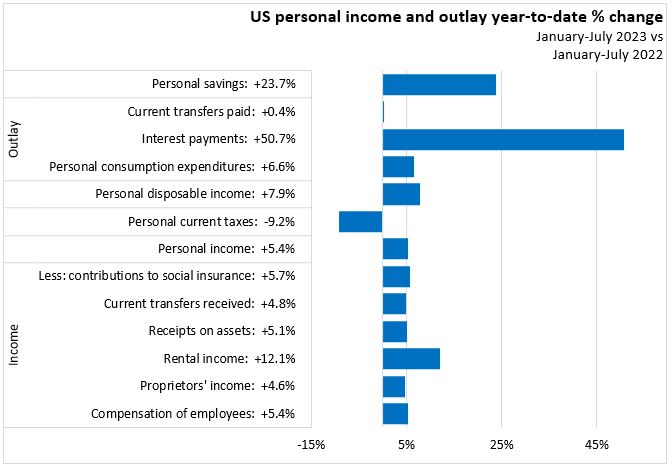
Through the first seven months of the year, US personal income has increased by 5.4% with gains from all income sources led by growth in rental income (+12.1%) offset by similar increases in contributions to social insurance. With an 9.2% decline in personal current taxes, year-to-date growth in personal disposable income (+7.9%) has outpaced growth in total personal income.
US personal consumption expenditures increased by 6.6% year-to-date in 2023, but this was outpaced by a 50.7% increase in interest payments as well as a 23.7% increase in year-to-date personal savings.
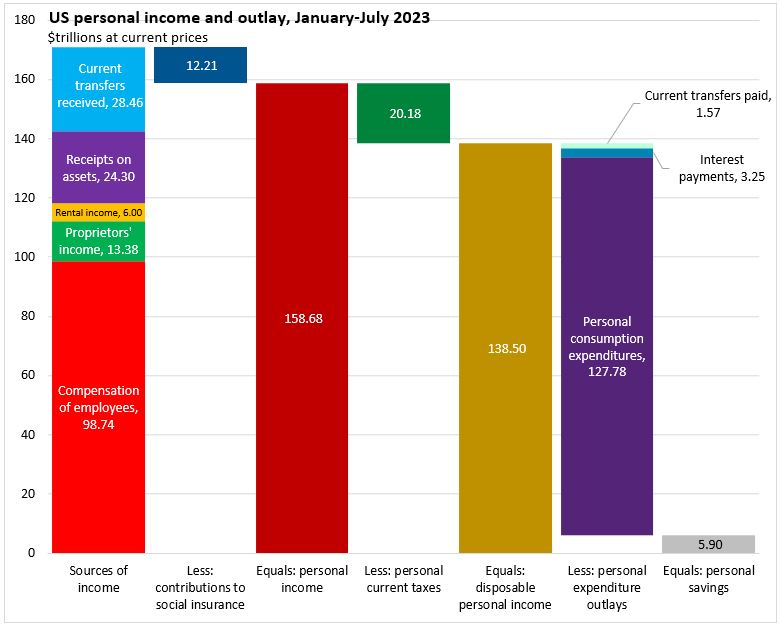
Through the first seven months of the year, US personal income amounted to $158.68 trillion, consisting of $98.74 trillion in employee compensation, $13.38 trillion in proprietors' income, $6.00 trillion in rental income, $24.30 trillion in receipts on assets and $28.46 trillion in current transfer receipts, less $12.21 trillion in social insurance contributions. After paying $20.18 trillion in personal current taxes, US personal disposable income was $138.50 trillion.
US personal consumption expenditures of $127.78 trillion accounted for the largest part of personal outlays, followed by $3.25 trillion in interest payments, $1.57 trillion in current transfers paid and $5.90 trillion in personal savings.
US Bureau of Economic Analysis. Press release, July 2023; Data retrieved from FRED, Federal Bank of St Louis, Table 2.6. Personal Income and Its Disposition, Monthly NIPA
<--- Return to Archive