The Economics and Statistics Division maintains archives of previous publications for accountability purposes, but makes no updates to keep these documents current with the latest data revisions from Statistics Canada. As a result, information in older documents may not be accurate. Please exercise caution when referring to older documents. For the latest information and historical data, please contact the individual listed to the right.
<--- Return to Archive
For additional information relating to this article, please contact:
September 05, 2023SURVEY ON LOCAL FOOD AND BENEFICIAL MANAGEMENT PRACTICES, 2022 Recently, Statistics Canada conducted the Survey on Local Food and Beneficial Management Practices, which collected information about local food sales and management practices considered beneficial from an environmental perspective on Canadian farms. In the survey, food sales are considered local if they happen within the province of production or, in the case of interprovincial food sales, within 50 km of where they were grown or raised.
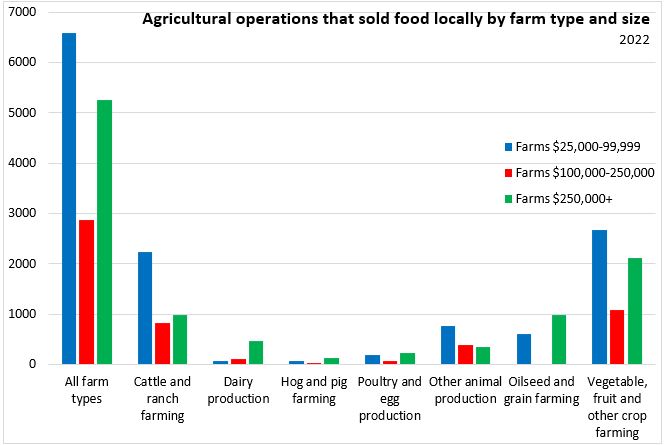
In 2022, Canada had 14,708 farms that sold locally, around 7.8% of all farm operations sold locally. Farms that had local sales between $25,000-$99,999 made up 44.7% of farms that were selling locally. Around 35.8% of locally selling farms had revenue more than $250,000. Vegetables, fruit, and crop farming made up the largest share of farms that sold locally, followed by cattle/ranch farming.
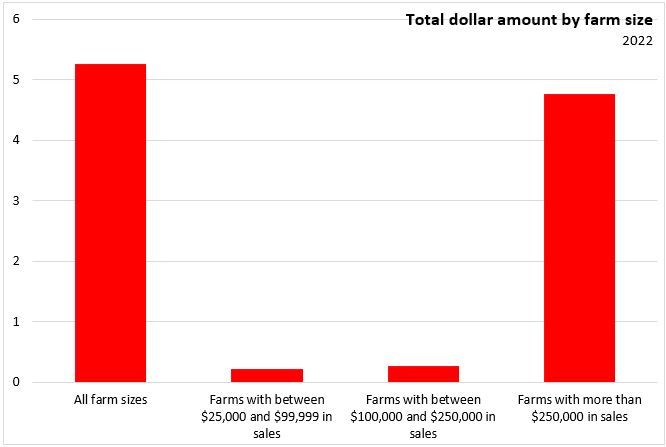
Canadian farms that sold locally, totaled $5.27 billion in sales in 2022. 90% of local sales came from farms with local sales of more than $250,000.
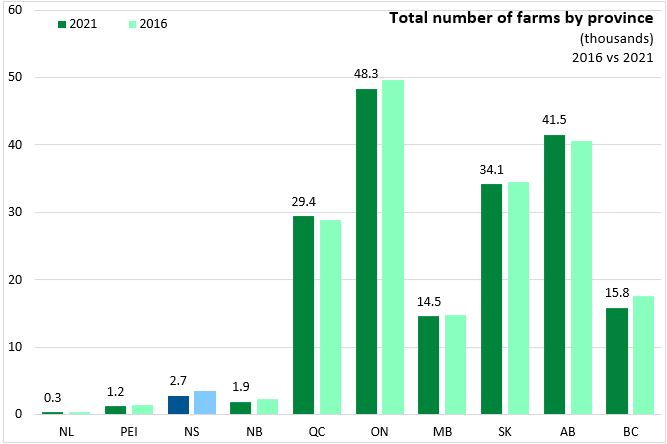
In Nova Scotia, the number of farms decreased to 2,741 (-21.2%) in 2021 compared to 2016. Nationally, farms decreased by 1.9% compared to 2016. The only growth in the number of farms was in Quebec and Alberta.
The survey also enquired about beneficial management practices, which are practices that reduce overall environmental risk. It examined two practices: application of urease or nitrification inhibitors, which is the process of applying fertilizers containing urease or nitrification inhibitors to improve nutrient use efficiency in agricultural operations and potentially limiting nitrogen run-off and greenhouse gas emissions; and rotational grazing, which consists of moving animals between fields to manage grazing and rest periods to improve the root systems plants build.
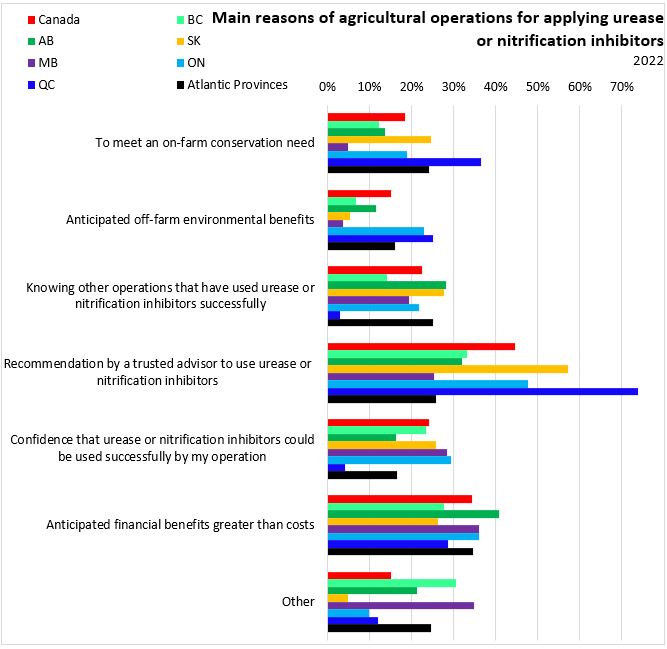
In Canada, the most common reason farmers used urease or nitrification inhibitors because they were recommended by a trusted advisor (44.5%). In Atlantic provinces, the most common reason farmers used urease or nitrification because they anticipate financial benefits greater than costs.
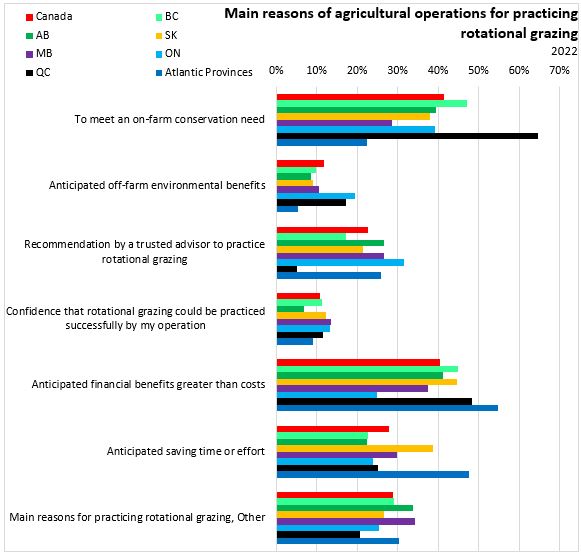
In 2022, many Canadian farmers practiced rotational grazing to meet an on-farm conservation need (41.5%). In Atlantic Canada, many farmers practiced rotational grazing due to financial benefit and anticipated time savings.
In 2022, Canada had 13.8 million acres of land that used rotational grazing and 11.63 million acres that used urease or nitrification inhibitors. Atlantic provinces made up 0.6% of land that used rotational grazing and 0.9% that used urease or nitrification process. Saskatchewan made up the largest portion for both processes in 2022.
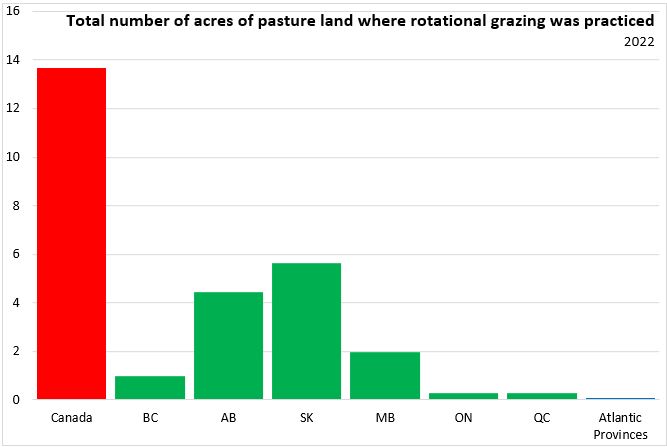
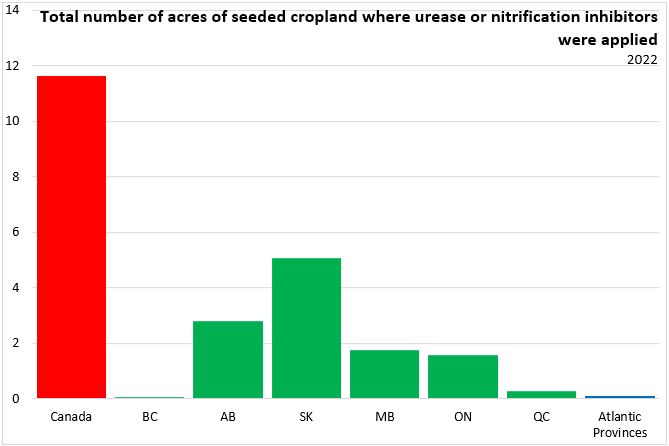
Table 32-10-0457-01 Agricultural operations that sold food locally, by farm size and farm type, 2022; Table 32-10-0459-01 Total dollar amount, average dollar amount per agricultural operation, and percentage of local food sales, by farm size, 2022; Table 32-10-0468-01 Main reasons of agricultural operations for applying urease or nitrification inhibitors, by province and farm type, 2022; Table 32-10-0471-01 Main reasons of agricultural operations for practicing rotational grazing, by province and farm type, 2022; Table 32-10-0469-01 Total number of acres of pasture land where rotational grazing was practiced, by province and farm type, 2022; Table 32-10-0466-01 Total number of acres of seeded cropland where urease or nitrification inhibitors were applied, by province and farm type, 2022; Table 32-10-0156-01 Farms classified by total farm area, Census of Agriculture historical data
<--- Return to Archive