The Economics and Statistics Division maintains archives of previous publications for accountability purposes, but makes no updates to keep these documents current with the latest data revisions from Statistics Canada. As a result, information in older documents may not be accurate. Please exercise caution when referring to older documents. For the latest information and historical data, please contact the individual listed to the right.
<--- Return to Archive
For additional information relating to this article, please contact:
October 04, 2023HOUSEHOLD INCOME, Q2 2023 In addition to compensation of employees, household income also includes net mixed income (generated from unincorporated businesses), property income received (generated as the result of ownership of assets) and current transfers received (generally from government).
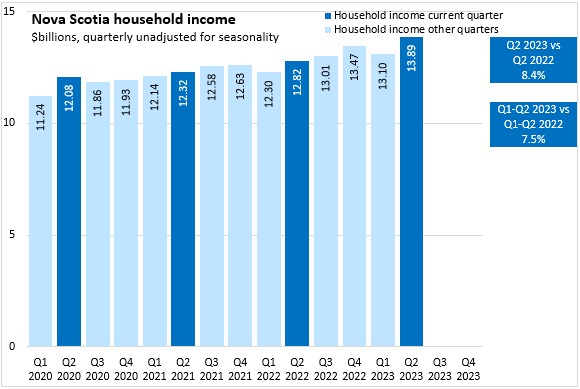
From Q2 2022 to Q2 2023, Nova Scotia's overall household income increased 8.4% to $13.89 billion.
In the first six months of the year, Nova Scotia's household income was up 7.5% compared with the same period in 2022.
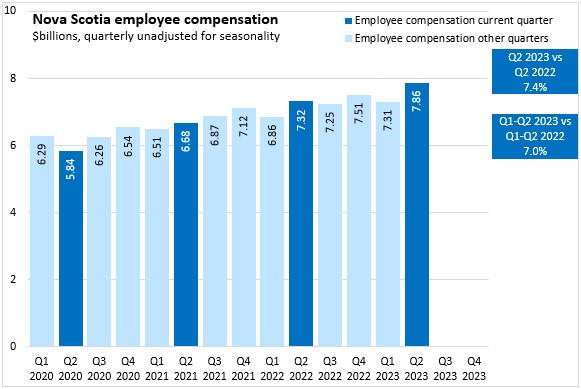
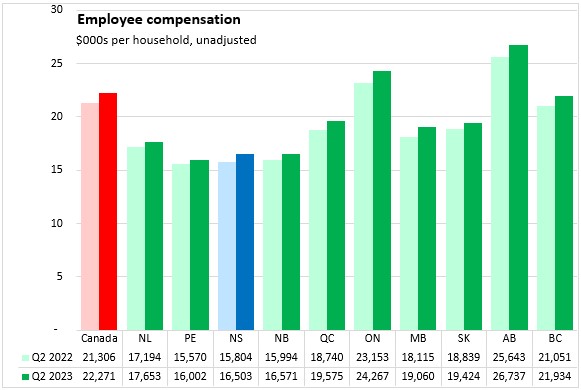
Employee compensation makes up the largest part of household income. In Q2 2023, Nova Scotia reported employee compensation of $7.86 billion, up 7.4% from the same period in 2022.
Employee compensation was up 7.0% in Nova Scotia, comparing the first half of 2023 with the first half of 2022.
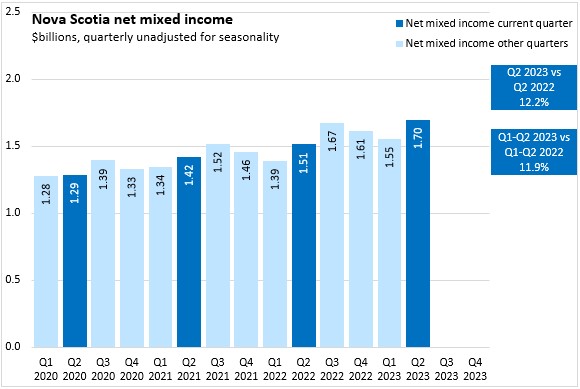
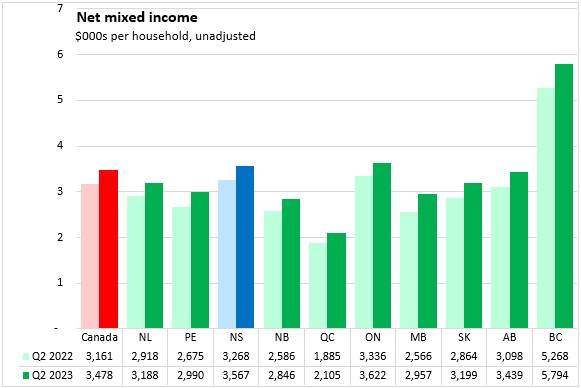
Net mixed income for households as a result of owning unincorporated businesses amounted to $1.70 billion in Q2 2023, up 12.2% from Q2 2022. Year-to-date net mixed income was up 11.9% in Nova Scotia.
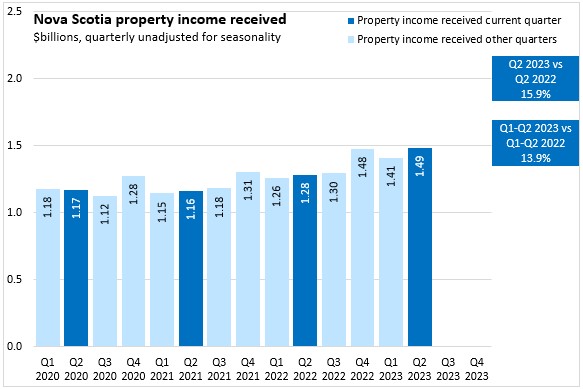
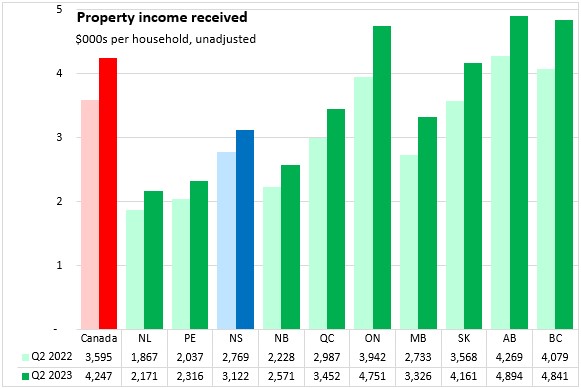
Nova Scotia's property income receipts were up 15.9% from Q2 2022 to Q2 2023, rising to $1.49 billion. Year-to-date property income receipts were up 13.9% in Nova Scotia.
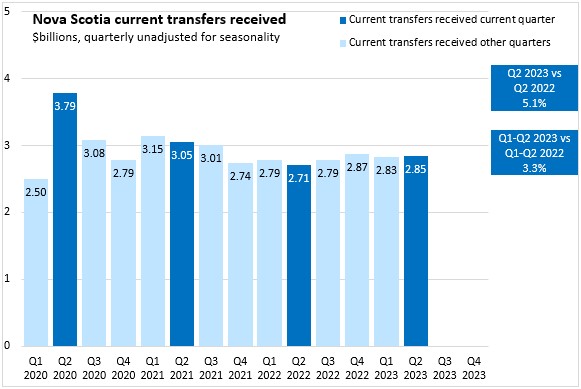
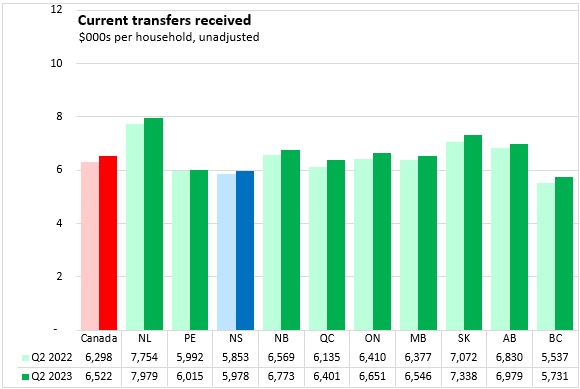
Current transfer income in Nova Scotia was up 5.1% from Q2 2022 to Q2 2023, rising to $2.85 billion. Year-to-date transfer income receipts were up 3.3% in Nova Scotia.
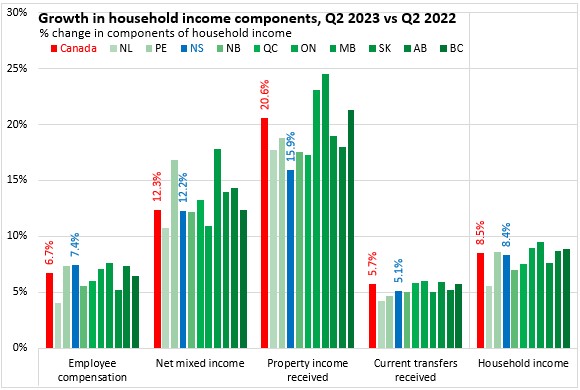
Nova Scotia's overall household income growth from Q2 2022 to Q2 2023 was 8.4% - just about the same as the national average of 8.5%. Household income growth was fastest in Manitoba and slowest in Newfoundland and Labrador.
Nova Scotia's rising household income reflected employee compensation growth of 7.4% (only behind Manitoba), which outpaced the national average of 6.7%. Newfoundland and Labrador reported the slowest year-over-year growth in employee compensation.
Nova Scotia's net mixed income grew 12.2% from Q2 2022 to Q2 2023, just about matching the national pace of 12.3% (led by Manitoba). Newfoundland and Labrador and Ontario reported the slowest gains in net mixed income over this period (even though both were up over 10%).
Despite a strong gain of 15.9% from Q2 2022 to Q2 2023, Nova Scotia's growth in property income receipts lagged all other provinces. The national average gain in property income received was 20.6% with faster growth in Ontario and Manitoba.
Current transfers received were up 5.1% in Nova Scotia from Q2 2022 to Q2 2023, behind the national pace of 5.7%. Ontario reported the fastest growth in transfers while Newfoundland and Labrador reported the least growth.
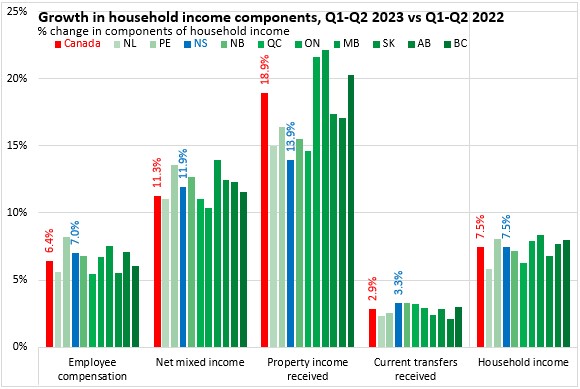
On a year-to-date basis (January-June 2023 vs January-June 2022), Nova Scotia's household income was up 7.5% - the same as the national pace. Manitoba reported the fastest year-to-date gains in household income while Newfoundland and Labrador reported the slowest.
Nova Scotia's employee compensation was up 7.0% year-to-date, outpacing the national gain of 6.4%. Prince Edward Island reported the fastest growth in employee compensation while Newfoundland and Labrador, Québec and Saskatchewan reported slower growth.
Nova Scotia's net mixed income was up 11.9% through the first half of the year, a stronger gain than the national pace of 11.3% (fastest growth: Manitoba, slowest: Ontario).
Nova Scotia's year-to-date property income receipts increased by 13.9% - the slowest among provinces. The national pace of property income growth was 18.9% year-to-date, led by Manitoba and Ontario.
Current transfers were up 3.3% in Nova Scotia through June, tied with New Brunswick for the fastest gain among provinces. The differences in growth rates were small as the national average growth rate was 2.9% and Alberta reported the slowest rise in transfers at 2.1%.
In Q2 2023, Nova Scotia's household income was $29,170 per household or 79.9% of the national average ($36,518). The highest income per household was in Alberta and lowest in Prince Edward Island.
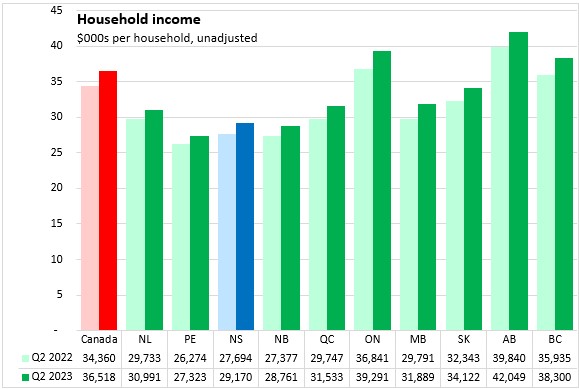
Nova Scotia's employee compensation $16,503 per household, amounting to 74.1% of the national average per household. Across Canada, employee compensation per household was $22,271. Alberta reported the highest employee compensation per household and Prince Edward Island the lowest.
Net mixed income generated by unincorporated businesses amounted to $3,567 per household, which was just above (102.6%) the national average per household of $3,478. Across Canada, the highest value of net mixed income per household was in British Columbia and the lowest was in Quebec.
Nova Scotia property income received in Q2 2023 was $3,122 per household, which was 73.5% of the national average ($4,247 per household). The highest property income values were in Alberta, British Columbia and Ontario. The lowest property income value was in Newfoundland and Labrador.
Current transfers received in Nova Scotia were $5,978 per household in Q2 2023. Current transfers received in Nova Scotia were 91.7% of the national average per household ($6,522). Transfers per household were highest in Newfoundland and Labrador and lowest in British Columbia.
Source: Statistics Canada. Table 36-10-0663-01 Distributions of household economic accounts, income, consumption and saving, Canada, provinces and territories, quarterly (x 1,000,000)
<--- Return to Archive