The Economics and Statistics Division maintains archives of previous publications for accountability purposes, but makes no updates to keep these documents current with the latest data revisions from Statistics Canada. As a result, information in older documents may not be accurate. Please exercise caution when referring to older documents. For the latest information and historical data, please contact the individual listed to the right.
<--- Return to Archive
For additional information relating to this article, please contact:
October 13, 2023HOUSEHOLD CONSUMPTION, Q2 2023 Household Income and Outlay
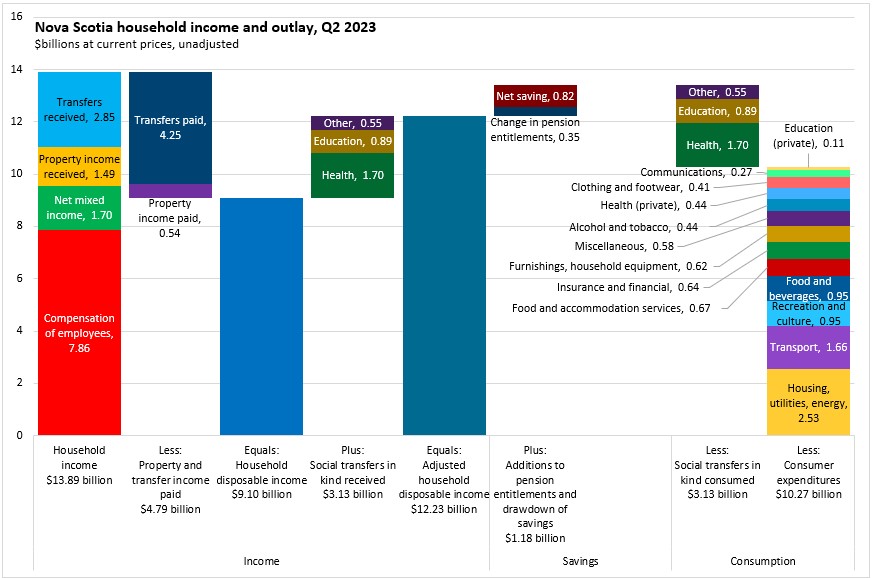
Nova Scotians received $13.89 billion in household income in Q2 2023, including $7.86 billion in employee compensation, $1.70 billion in net mixed income (from unincorporated businesses), $1.49 billion in property income received and $2.85 in current transfers received (primarily from governments).
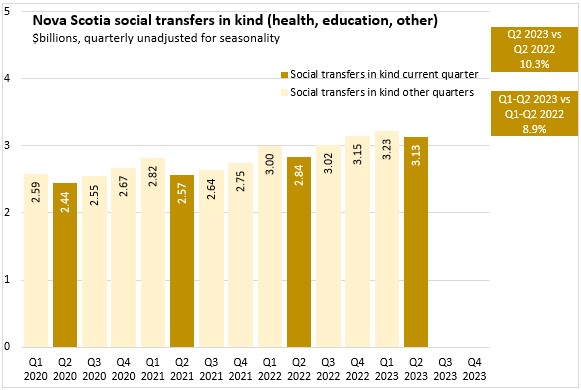
After paying current transfers (including income taxes) and property income, Nova Scotia disposable income was $9.10 billion in Q2 2023. Including the $3.13 billion value of social transfers in kind received from governments or non-profits in the form of services provided for households, Nova Scotia had adjusted disposable income of $12.23 billion.
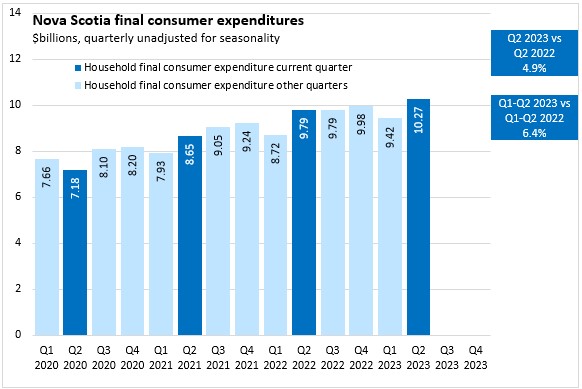
The consumption of social transfers in kind matches the value of social transfers received ($3.13 billion), while households spent $10.27 billion on consumer expenditures. The value of household final consumption expenditures and social transfers in kind exceeded adjusted household disposable income, so the difference must be made up out of negative savings, including a reduction of $0.82 billion in household savings and a further $0.35 billion change in pension entitlements.
Household Consumer Expenditures
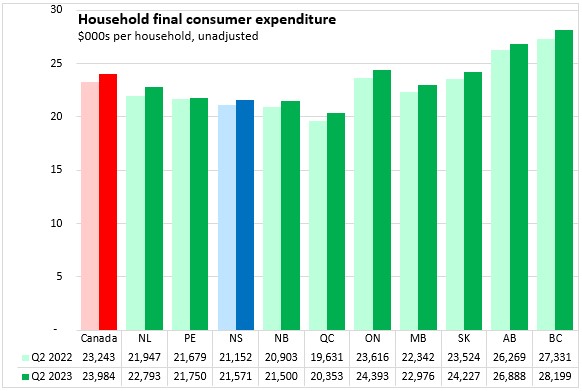
Nova Scotia's final consumer expenditures (paid for private by households) amounted $21,571 per household (89.9% of the national average per household). Across Canada, final consumer expenditures per household were $23,984 with the highest value in British Columbia and the lowest in Quebec.
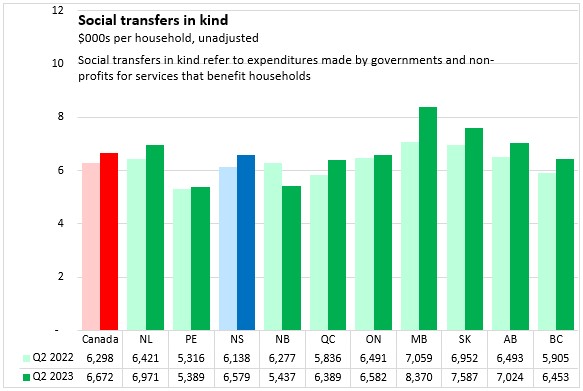
Social transfers in kind refer to services that are provided for the benefit of households but are paid for by governments and non-profits. These are primarily health and education expenditures, which add to private expenditures made on these services.
In Q2 2023, Nova Scotian households received $6,579 per household (98.6% of the national average per household). Across Canada, social transfers in kind were $6,672 per household with the highest values in Manitoba and the lowest values in Prince Edward Island.
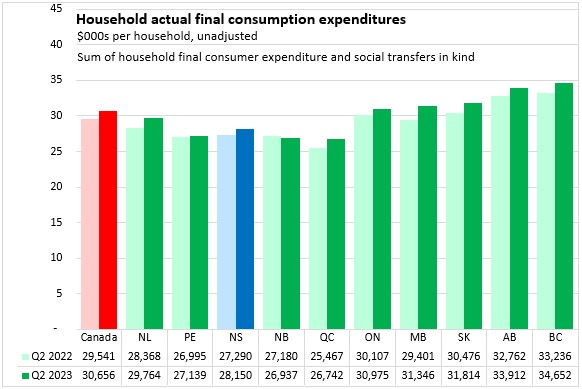
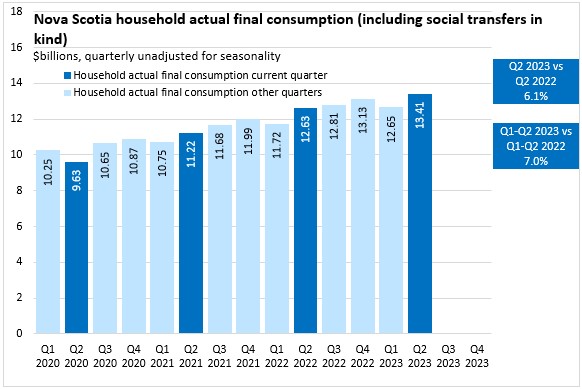
The sum of household final consumer expenditures and social transfers in kind is termed 'household actual final consumption expenditures', which reflects the benefits to households from both private expenditures as well as services provided by governments and non-profits.
Nova Scotia's household actual final consumption expenditures in Q2 2023 were $28,150 per household (91.8% of the national average per household). National household actual final consumption expenditures were $30,656 per household with the highest value in British Columbia and the lowest value in Quebec.
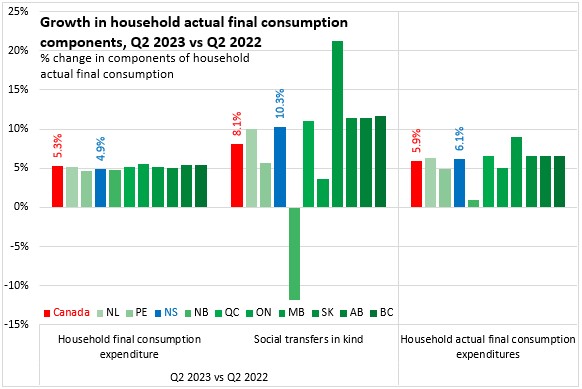
Comparing Q2 2023 with Q2 2022, Nova Scotia's household consumer expenditures increased by 4.9%, slower than the national pace of 5.3%. Ontario, Alberta and British Columbia reported the fastest growth while the Maritime provinces reported the slowest (though the difference from the fastest to the slowest was only 80 basis points)
Social transfers in kind increased by 10.3% in Nova Scotia (8.1% nationally). Social transfers in kind grew fastest in Manitoba while New Brunswick reported the only decline.
Combining these two components led to household actual final consumption growth of 6.1%, just outpacing the national growth of 5.9%. Manitoba reported the fastest growth while New Brunswick reported the slowest.
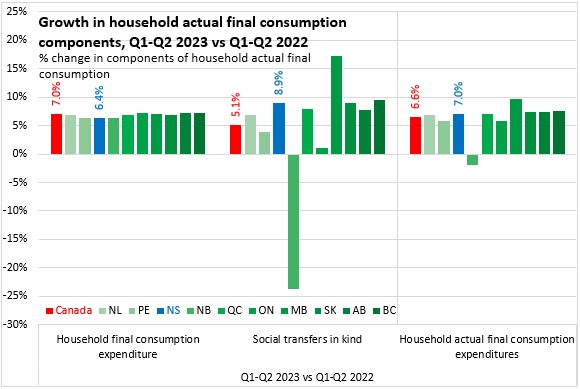
On a year-to-date basis (Q1-Q2 2023 vs Q1-Q2 2022), Nova Scotia's household final consumption expenditures were up 6.4% - slower than the national pace of 7.0%. Ontario, Alberta and British Columbia reported the fastest growth in household consumption expenditures while the Maritime provinces reported the slowest growth (though all were over 6% on a year-to-date basis).
Social transfers in kind were up 8.9% year-to-date in Nova Scotia. National social transfers in kind grew by 5.1% with the fastest rise in Manitoba. Social transfers were up in all provinces except New Brunswick.
Household actual final consumption (household consumption expenditures plus social transfers in kind) was up 7.0% in Nova Scotia through the first six month of the year. Canada's household actual final consumption expenditures grew 6.6% year-to-date with the fastest growth in Manitoba and the only decline in New Brunswick.
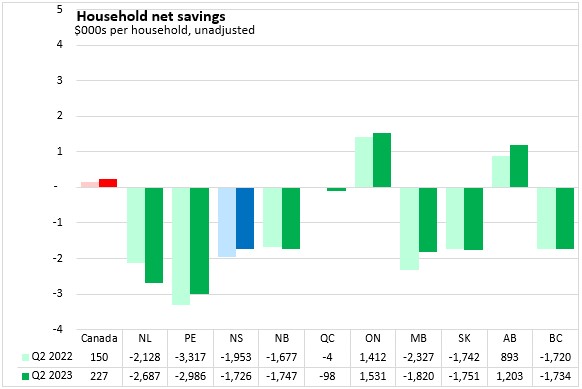
In Q1 2023, Nova Scotia's net savings per household were -$1,726. Only Ontario and Alberta reported positive net savings in Q2 2023 - though this was enough to bring national savings up to an average of $277 per household.
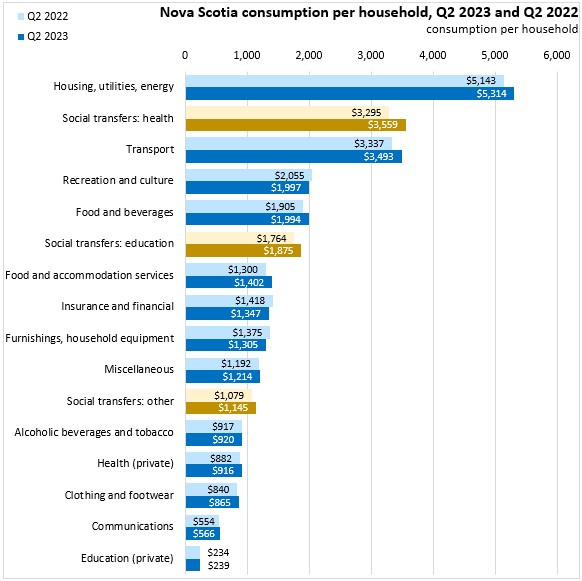
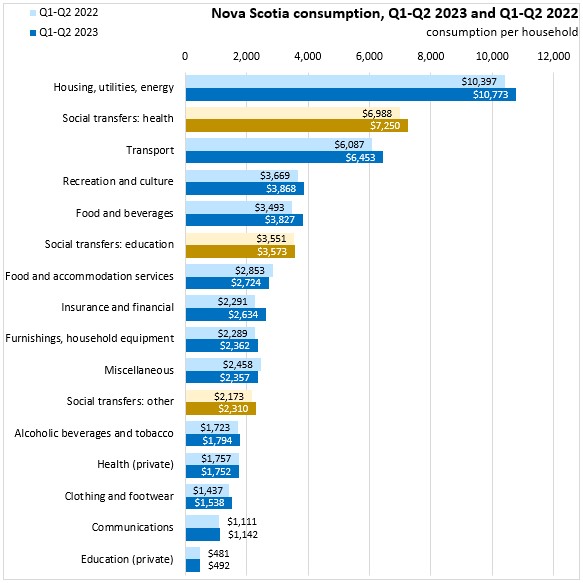
Among the categories of actual final consumption expenditures, housing/utilities/energy made up the largest category of household consumer expenditures, followed by social transfers in kind for health care, transportation, recreation/culture and food/beverages.
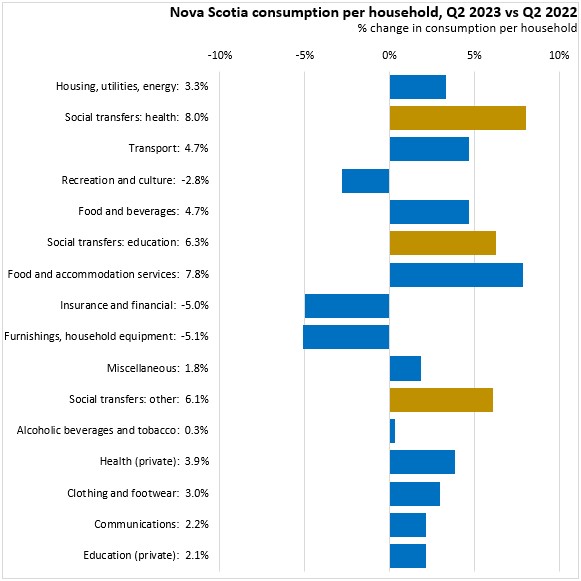
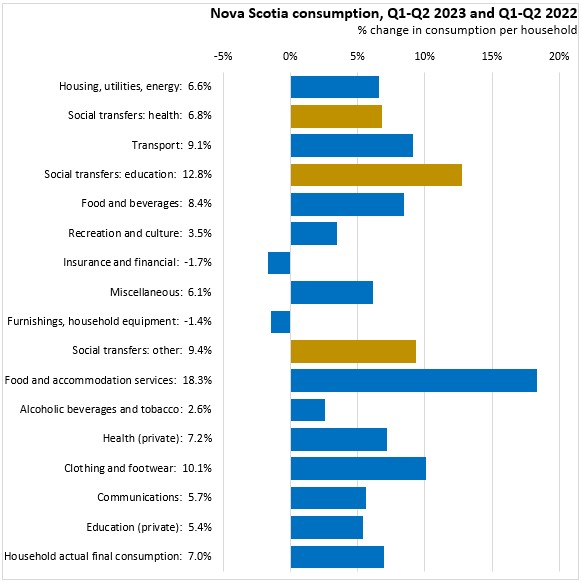
From Q2 2022 to Q2 2023, growth in per household spending was fastest in social transfers for health, food and accommodation services, social transfers for education and other social transfers. Expenditures were down for recreation/culture, insurance/financial services and household furnishings/equipment.
Over the first six months of the year, actual final consumption expenditures per household were up most (in percentage terms) for food/beverage services, social transfers for education and clothing/footwear.
Source: Statistics Canada. Table 36-10-0663-01 Distributions of household economic accounts, income, consumption and saving, Canada, provinces and territories, quarterly (x 1,000,000)
<--- Return to Archive