The Economics and Statistics Division maintains archives of previous publications for accountability purposes, but makes no updates to keep these documents current with the latest data revisions from Statistics Canada. As a result, information in older documents may not be accurate. Please exercise caution when referring to older documents. For the latest information and historical data, please contact the individual listed to the right.
<--- Return to Archive
For additional information relating to this article, please contact:
November 22, 2023GOVERNMENT FINANCIAL STATISTICS, 2022 Statistics Canada has published the latest Consolidated Government Finance Statistics (CGFS) for 2022 including consolidated results for provincial-territorial plus local governments. Statistics Canada's data allows for comparability across jurisdictions, as well as consistency with the government consumption and investment data reported in macroeconomic accounts.
These data are based on the international government financial statistical standard and, as such, may differ in their presentation from similar concepts reported in Public Accounts and other government financial statements. CGFS data differ from reports published by governments due to differences in institutional coverage, accounting rules, timing and integration with the Canadian macroeconomic accounts.
The following analysis compares the per capita results for consolidated provincial-and-local governments. Local governments are consolidated into the analysis because each provincial government may assign different responsibilities to municipal or local governments.
Revenues and Taxes
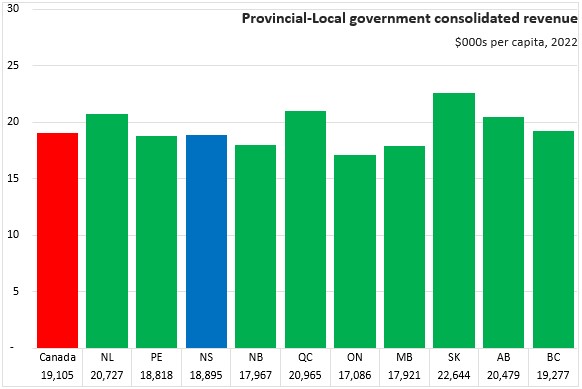
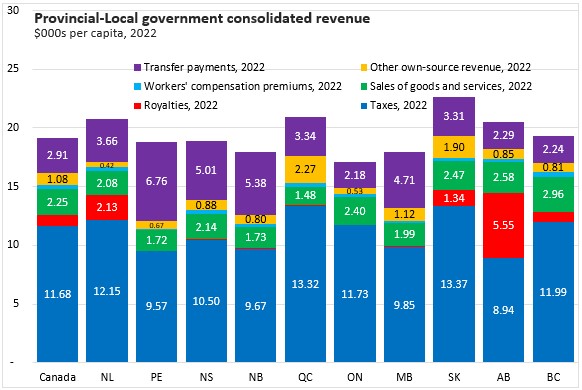
Total revenues per capita vary across the country, with Nova Scotia's provincial-local government revenues amounting to $18,895 per capita in 2022. This was lower than the Canadian average of $19,105 per capita. The highest per capita revenues were in Saskatchewan ($22,644), where the government offers a different mix of public services, including delivering some services that are otherwise delivered by the Federal government (the value of the Quebec abatement to Federal taxes was $840 per capita and is included in revenue figures presented here). The lowest per capita revenues were in Ontario ($17,086).
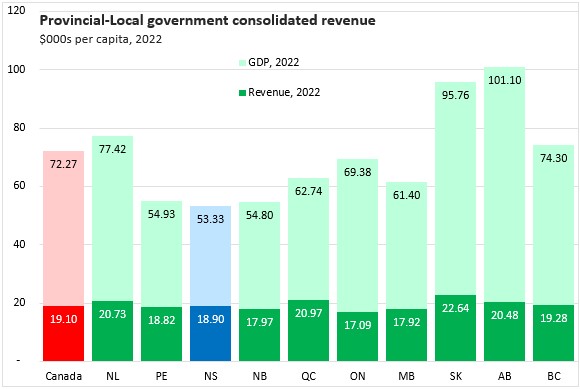
Although Nova Scotia's provincial-local government revenues were 98.9% of the national per capita average, Nova Scotia's nominal GDP per capita was 74% of the national average (lowest among provinces). Thus, provincial-local government revenues amounted to a larger portion of Nova Scotia's comparatively smaller GDP per capita.
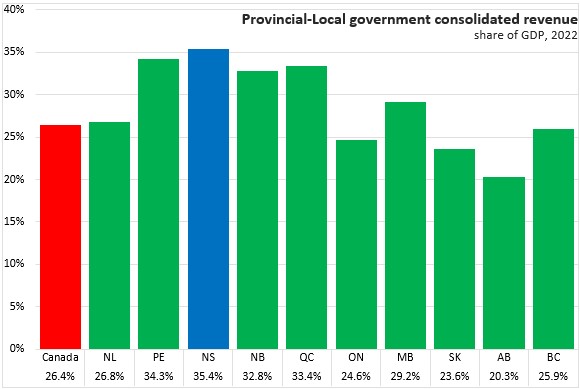
With Nova Scotia's lowest GDP per capita, Nova Scotia's provincial-local government consolidated revenues amount to 35.4% of provincial GDP - the highest share among provinces. Nationally, provincial-local consolidated revenues amounted to 26.4% of GDP. In contrast to Nova Scotia, Alberta's GDP per capita was the highest among provinces - 90% higher than that of Nova Scotia. So even though Alberta's per capita provincial-local consolidated revenues were higher, they only amounted to 20.3% of that province's GDP.
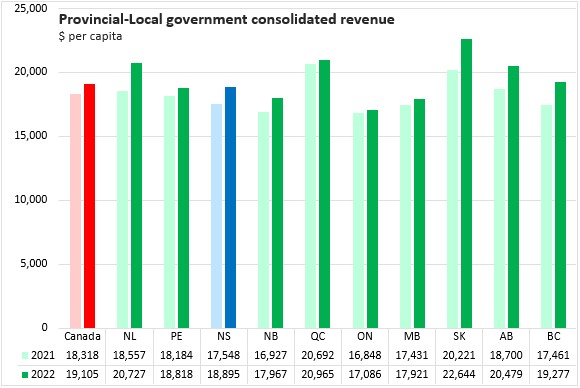
Per capita revenues increased by 7.7% in Nova Scotia from 2021 to 2022. This outpaced the national growth of 4.3% in revenues per capita. Saskatchewan (+12.0%) reported the fastest growth while Québec (+1.3%) reported the slowest rise.
Taxes and transfers made up the largest portions of provincial-local consolidated government revenues in 2022.
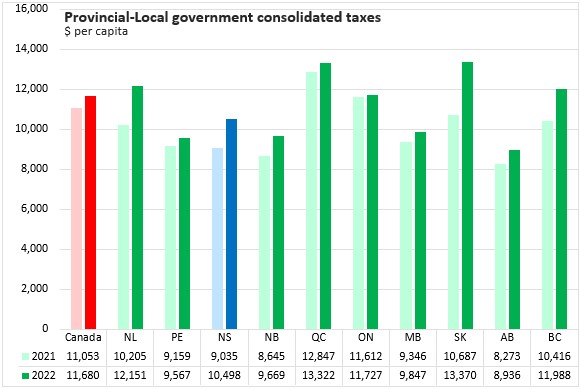
Taxes are typically the largest source of consolidated provincial-local government revenues. Nationally, provincial-local consolidated tax revenues amounted to amounting to $11,680 per capita across Canada. Nova Scotia's tax revenues were $1,182 per capita lower than the national average at $10,498 per capita. The highest provincial-local tax revenues were in Saskatchewan at $13,370 per capita and in Québec at $13,322 (before the $840 per capita Quebec abatement of Federal taxes).
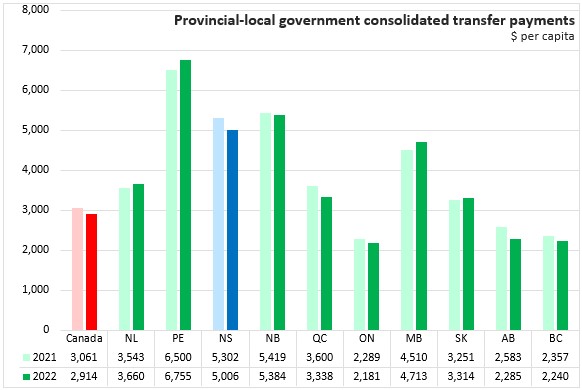
Beyond taxes and user fees, consolidated provincial-local governments generate revenues from workers compensation premiums, fiscal transfer payments, interest/dividend income, royalties and sales of goods/services. Those provinces that are Equalization recipients report higher fiscal transfer revenues per capita, particularly in the Maritimes and Manitoba.
Provinces with substantial oil and gas sectors (and to a lesser extent hydroelectricity and forestry) report stronger royalty income. Saskatchewan and Quebec also report substantially higher revenues from other sources, though this may include specific items that cannot be classified with others. In Statistics Canada's data, consolidated revenue from sales of goods and services includes tuition fees.
Per capita taxes for provincial-local governments increased 5.7% from 2021 to 2022 across the country. Nova Scotia's taxes per capita increased by 16.2% - third fastest after Saskatchewan (+25.1%) and Newfoundland and Labrador (+19.1%). Per capita taxes grew slowest in Ontario (+1.0%).
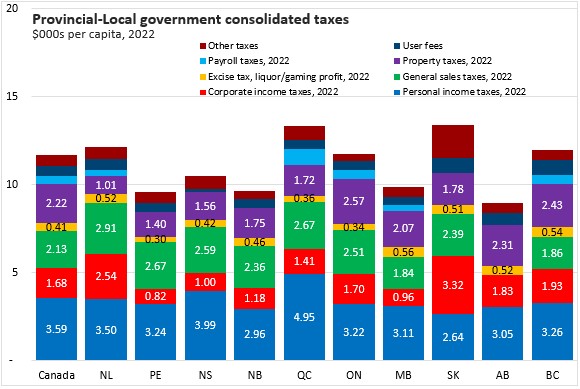
Tax revenues break down into 8 major categories, including personal income taxes, corporate income taxes, general sales taxes, excise taxes/profits of fiscal monopolies, payroll taxes, property taxes, user fees and other taxes. The amount of revenues generated by these taxes reflects both the tax system itself (tax rates, deductions, credits, number of taxes levied) as well as overall economic conditions.
There are also differences in specific taxes across Canada. Alberta has no general sales tax. Alberta relies more on property taxes and user fees for revenues than most other provinces. Only Newfoundland and Labrador, Quebec, Ontario, Manitoba and British Columbia generate revenue from payroll taxes. Corporate income taxes per capita were higher in Saskatchewan as well as Newfoundland and Labrador.
Canada's Federal government increased transfers to the provinces to assist with responding to the COVID-19 public health emergency and these were largely withdrawn by 2022. Per capita transfers were down in 6 of 10 provinces and for the country as a whole. Per capita transfer revenues were up in Prince Edward Island, Saskatchewan, Manitoba and Newfoundland and Labrador.
Expenses
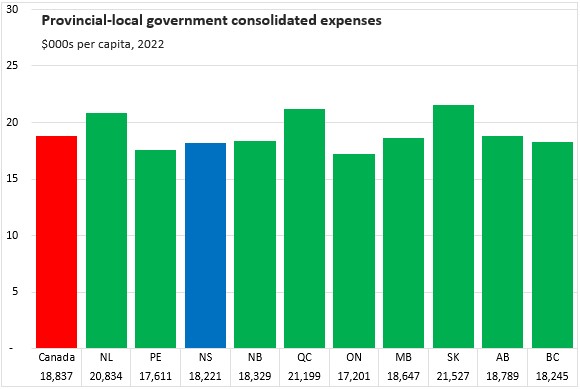
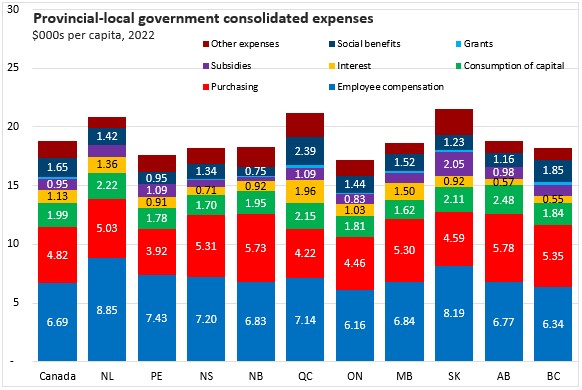
Consolidated provincial-local government expenditures in Canada were $18,837 per capita. Nova Scotia's consolidated provincial-local government expenditures were $18,221 per capita. The highest per capita expenditures were in Saskatchewan ($21,527) and Québec ($21,199). The lowest per capita expenditures were in Ontario ($17,201).
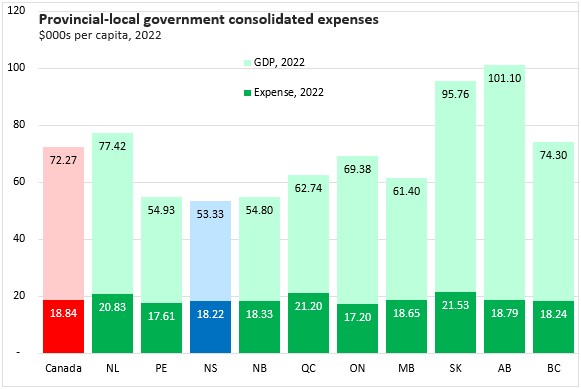
As with consolidated provincial-local government revenues, modest differences in per capita expenditures appear larger when measured relative to GDP per capita, which remained substantially larger in resource-producing provinces.
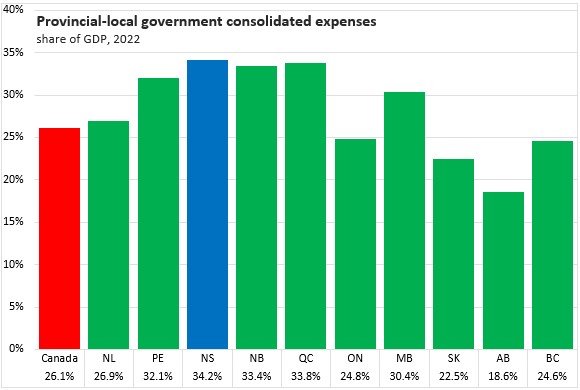
Nova Scotia's provincial local consolidated government expenditures amounted to 34.2% of GDP - the highest among provinces. Across Canada, provincial-local expenditures amounted to 26.1% of GDP. With high GDP per capita, Alberta's provincial-local expenditures were 18.6% of GDP.
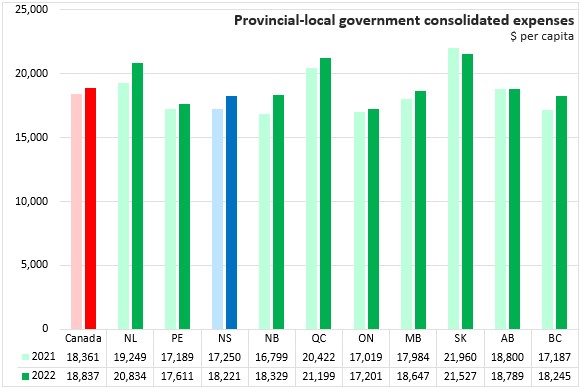
Consolidated provincial-local government expenditures increased in all provinces except Saskatchewan and Alberta from 2021 to 2022. Growth in Nova Scotia was 5.6% in Nova Scotia, outpacing the national growth of 2.6%. Growth was fastest in New Brunswick (+9.1%).
Employee compensation was the largest component across national consolidated provincial-local expenditures, amounting to $7,204 per capita in Nova Scotia ($6,691 nationally). The highest employee compensation expenditures per capita were found in Newfoundland and Labrador and Saskatchewan. The lowest were reported in Ontario and British Columbia.
Purchases of goods and services was the next largest expenditure category with a national average provincial-local government expenditure of $4,819 per capita. Nova Scotia provincial-local purchases of goods and services were $5,311 per capita. Expenditures on goods and services were highest in Alberta and New Brunswick. Prince Edward Island reported the lowest per capita purchases of goods and services by provincial-local governments.
Interest expenses depend on net financial liabilities and costs of funds. Across Canada, provincial-local expenditures on interest payments averaged $1,125 per capita while interest costs were $708 per capita in Nova Scotia (third lowest after Alberta and British Columbia). The highest interest expenditures were in Quebec.
Subsidies (particularly in agriculture) were uneven across the country, with an average of $948 per capita. The highest per capita subsidy payments were in Saskatchewan at $2,048 per capita - the largest by a wide margin. The lowest subsidies were paid in New Brunswick ($286 per capita), followed by Nova Scotia at $595 per capita.
Social assistance and family/employment benefit expenditures per capita were $1,654 per capita across Canada, including notably higher expenditures in Québec. Nova Scotia's social benefits per capita from provincial-local governments were $1,339 in 2022. The lowest social benefits were paid in New Brunswick ($754 per capita) and Prince Edward Island ($949 per capita).
Net Operating Balance
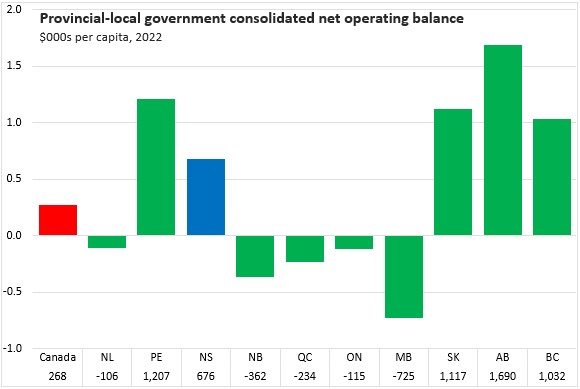
The net operating balance of the consolidated provincial-local government sector reflects the difference between revenues and expenses. As this includes local governments, colleges, universities, workers' compensation boards and other entities, it is not comparable to statements of surplus or deficit for Provincial governments as reported in their respective Public Accounts.
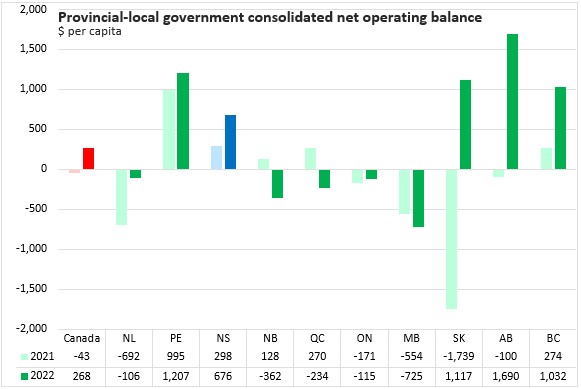
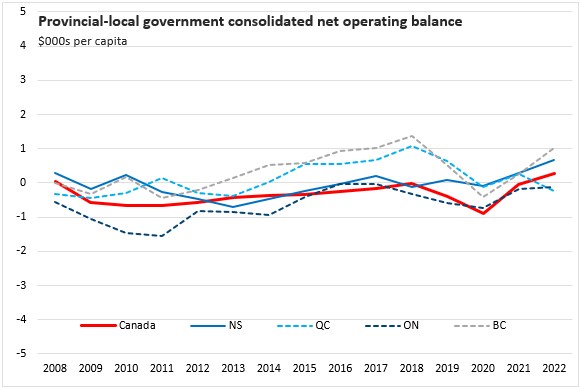
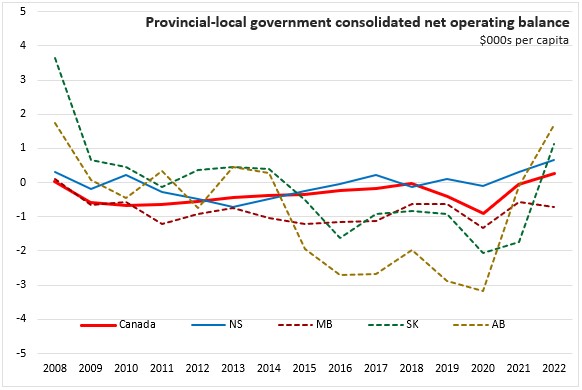
In 2022, Nova Scotia ($676 per capita), British Columbia ($1,032 per capita), Saskatchewan ($1,117 per captia), Prince Edward Island ($1,207 per capita) and Alberta ($1,690 per capita) all had positive net operating balances for provincial-local consolidated government. The largest net operating deficits was reported in Manitoba (-$725 per capita). The consolidated provincial-local government sector reported a surplus of $268 per capita across Canada.
The consolidated provincial-local government sectors reported improvement in net operating balances except for New Brunswick, Québec and Manitoba.
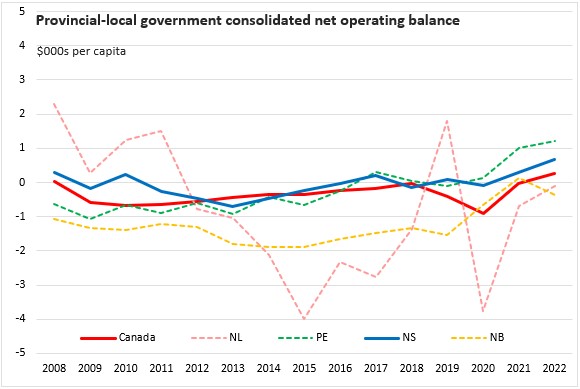
Nova Scotia's consolidated provincial-local government net operating balance has been improving slowly but steadily 2008. There have been more rapid improvements for Newfoundland and Labrador, Saskatchewan and Alberta (and to a lesser extent Prince Edward Island).
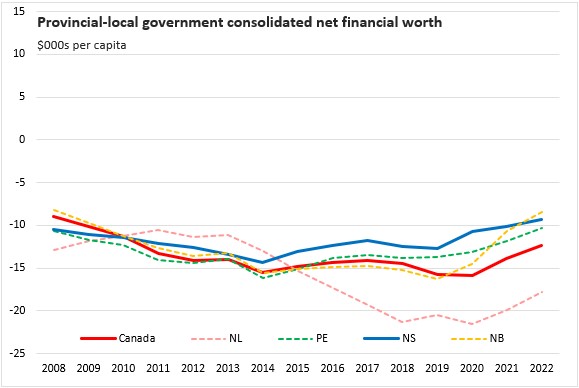
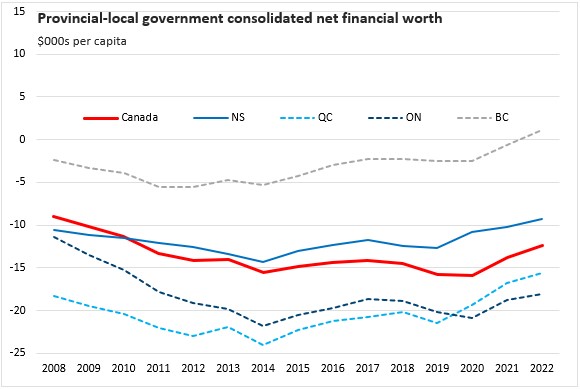
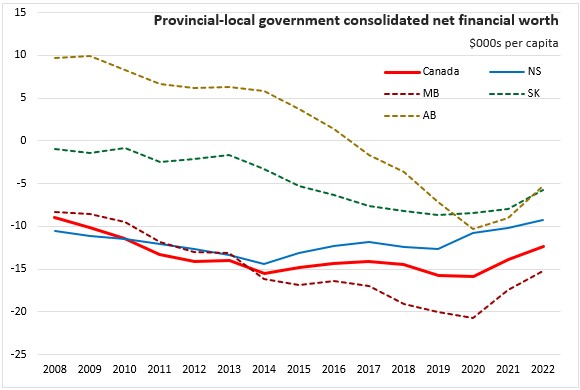
Net Financial Worth
As with net operating balance, the net financial worth of the consolidated provincial-local government sector includes different entities and accounting treatments than reported by Provincial governments in Public Accounts.
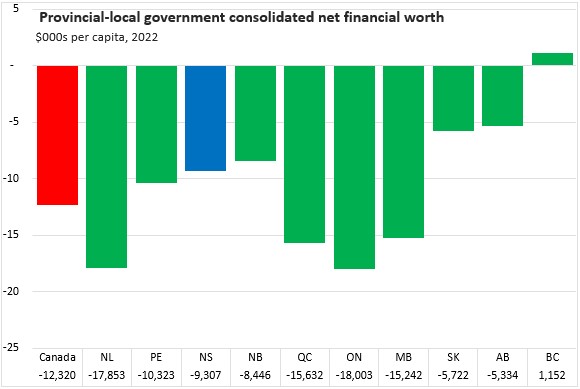
All provinces except British Columbia report negative net financial worth of consolidated provincial-local governments, with an average of -$12,320 per capita across Canada. The three westernmost provinces had the strongest net financial worth in 2022, followed by the three Maritime provinces. Nova Scotia's provincial-local government net financial worth was -$9,307 per capita. The largest negative net financial worth per capita values were reported in Newfoundland and Labrador, Ontario and Québec.
Net financial worth per capita improved for all provinces in 2022. The largest per capita improvement was reported in Alberta; the smallest improvements were in Nova Scotia and Ontario.
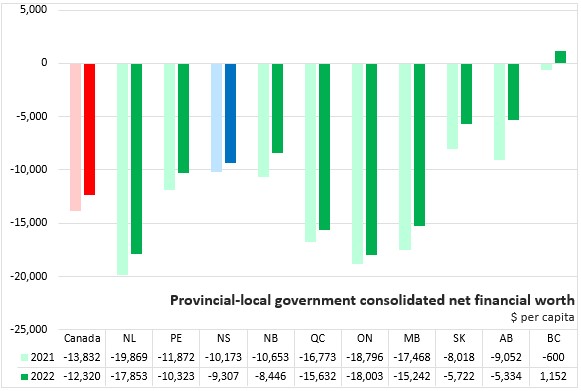
Most provinces are reporting improvements in net financial worth in recent years.
Statistics Canada. Table 10-10-0147-01 Canadian government finance statistics (CGFS), statement of operations and balance sheet for consolidated governments (x 1,000,000); Table 17-10-0009-01 Population estimates, quarterly; Table 36-10-0222-01 Gross domestic product, expenditure-based, provincial and territorial, annual (x 1,000,000)
<--- Return to Archive