The Economics and Statistics Division maintains archives of previous publications for accountability purposes, but makes no updates to keep these documents current with the latest data revisions from Statistics Canada. As a result, information in older documents may not be accurate. Please exercise caution when referring to older documents. For the latest information and historical data, please contact the individual listed to the right.
<--- Return to Archive
For additional information relating to this article, please contact:
December 06, 2023GDP BY CENSUS METROPOLITAN AREA, 2020 Statistics Canada has released Gross Domestic Product (GDP) data for Canada's Census Metropolitan Areas (CMAs) and the areas outside of CMAs for 2020. All data are benchmarked to provincial nominal GDP at basic prices.
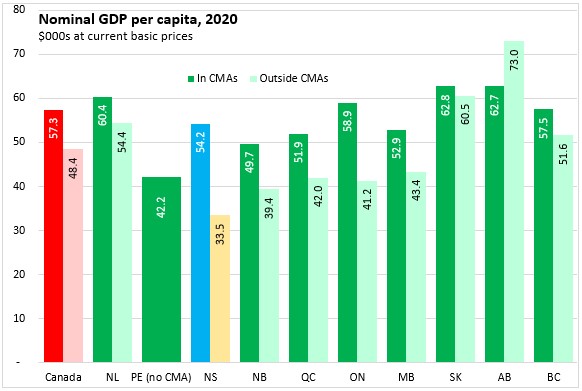
Despite widespread GDP declines observed during the first waves of the COVID-19 pandemic, these results continue to show that just over half (53.0%) of Canada's GDP was generated in six CMAs: Toronto, Montréal, Vancouver, Calgary, Edmonton and Ottawa. GDP and population are similar concentrated in CMAs. In 2020, CMAs accounted for 74.1% of Canada's population and generated 75.7% of Canadian GDP.
In Nova Scotia, Halifax accounted for 45.9% of provincial population and 57.9% of provincial GDP.
In 2020 GDP per capita amongst all CMAs was $57,341 and Halifax's GDP per capita was $54,217. The largest GDP per capita among CMAs was found in Calgary, Regina, Toronto, and Ottawa. However, these results may be sensitive to fluctuations in commodity prices, particularly in the first waves of the pandemic. The lowest GDP per capita levels among reported CMAs were observed in Oshawa, Peterborough and Barrie.
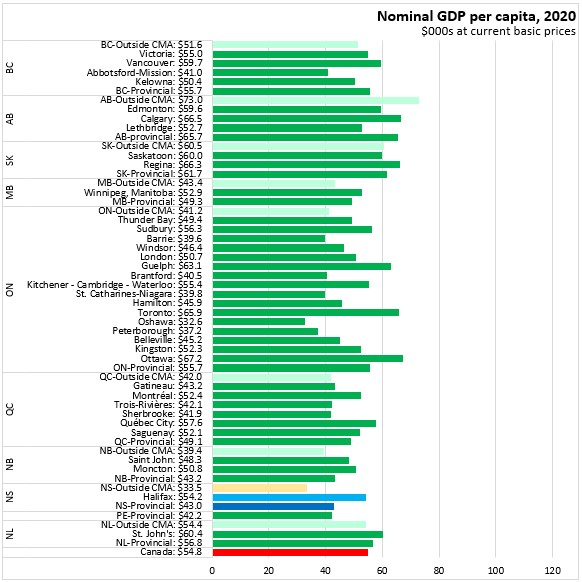
Outside CMAs, GDP per capita was $51,484. The highest non-CMA GDP per capita was observed in Alberta at $72,960 (higher GDP per capita than any CMA), and this was after a 28.3% decline on lower commodity prices. The lowest non-CMA GDP was reported in Nova Scotia ($33,481). Only Oshawa reported a lower GDP per capita than Nova Scotia outside the Halifax CMA.
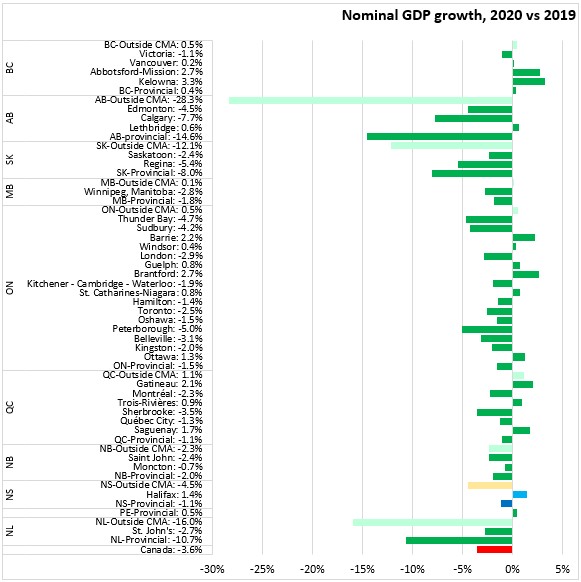
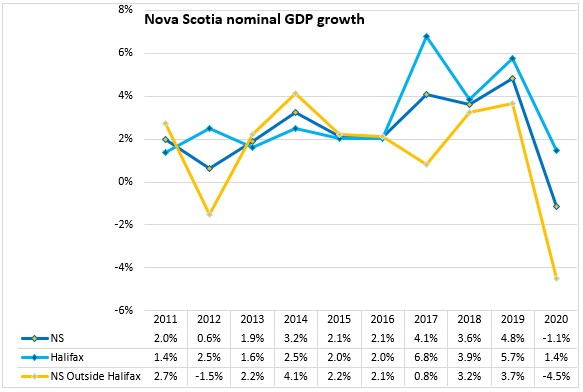
From 2019 to 2020, Nova Scotia's nominal GDP fell by 1.1%. Halifax GDP grew by 1.4% while GDP outside the city contracted by 4.5%. Across Canada, nominal GDP fell by 2.6% in 2020, with most CMAs reporting declines. The largest contractions were in non-CMA areas of Alberta, Newfoundland and Labrador and Saskatchewan (all of which were affected by low commodity prices). Among CMAs, Calgary, Regina and Peterborough reported the largest declines in nominal GDP in 2020 while Kelowna, Abbotsford-Mission and Brantford reported the largest gains.
Nova Scotia's nominal GDP in 2020 was $42.2 billion, of which $24.4 billion was generated in Halifax and $17.8 billion was generated outside of Halifax. Prior to the pandemic, GDP had been rising in both Halifax and the outside of Halifax.

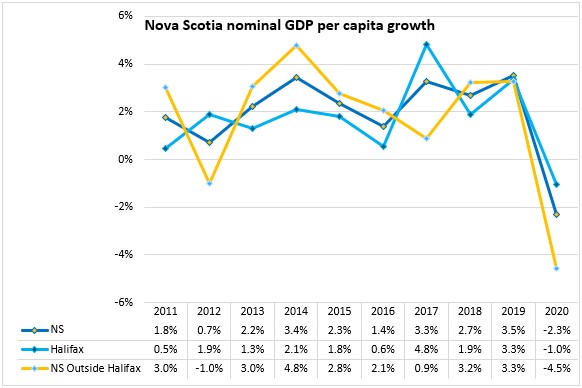
In 2020, accelerating population growth outstripped the rise in GDP for Halifax, resulting in lower GDP per capita in for Halifax, non-CMA areas of Nova Scotia and for the province as a whole.
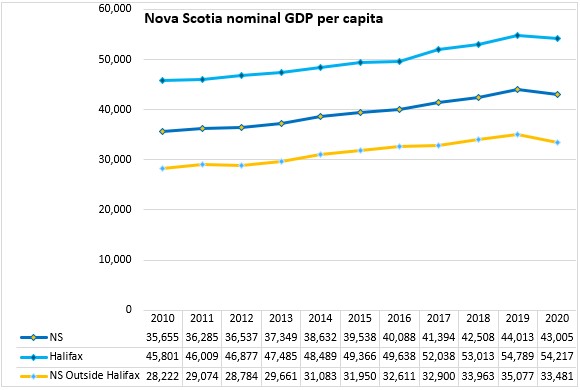
Nominal GDP growth for Halifax was positive in 2020, but this was offset by a larger contraction in nominal GDP outside the city.
Although Halifax's nominal GDP increased in 2020, it was slower than the rise in population. This led to a 1.0% decline in Halifax's per capital nominal GDP in 2020.
 Source: Statistics Canada. Table 36-10-0468-01 Gross domestic product (GDP) at basic prices, by census metropolitan area (CMA) (x 1,000,000); Table 17-10-0135-01 Population estimates, July 1, by census metropolitan area and census agglomeration, 2016 boundaries; Table 17-10-0005-01 Population estimates on July 1st, by age and sex
<--- Return to Archive