The Economics and Statistics Division maintains archives of previous publications for accountability purposes, but makes no updates to keep these documents current with the latest data revisions from Statistics Canada. As a result, information in older documents may not be accurate. Please exercise caution when referring to older documents. For the latest information and historical data, please contact the individual listed to the right.
<--- Return to Archive
For additional information relating to this article, please contact:
January 05, 2024LABOUR MARKET TRENDS, ANNUAL 2023 Ages 15+ (2023 vs 2022, annual averages)
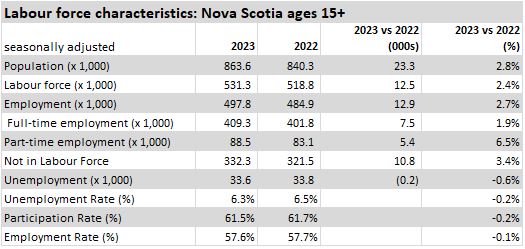
Compared with the annual average from 2022, Nova Scotia's population of working age grew by 23,300 (+2.8%) on average in 2023. The labour force increased 2.4% (+12,500) while employment grew 2.7% (+12,900). With stronger growth in employment than labour force, Nova Scotia's annual average unemployment rate fell to 6.3% - the lowest annual average since 1970.
Full time employment was up by 7,500 and part time employment was up 5,400 (including changes of hours within the same position).
There was an increase in the number of persons not in the labour force of 10,800 (+3.4%).
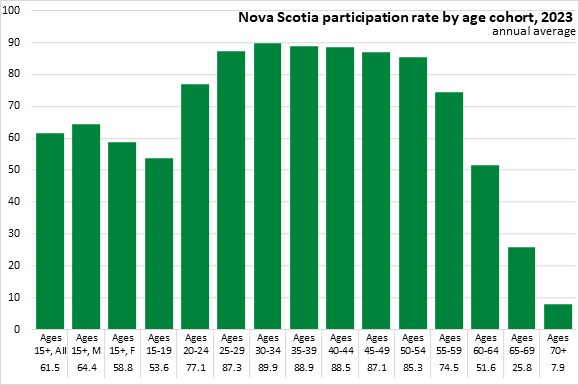
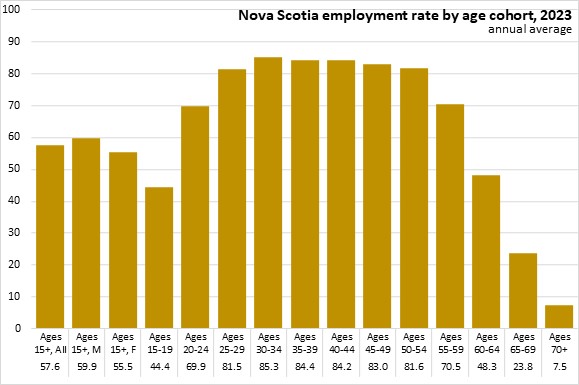
As labour force growth lagged the population, Nova Scotia's participation rate contracted to 61.5% in 2023. Rising employment pushed the annual average employment rate up to 57.6% for 2023.
Age and sex cohorts (2023 vs 2022, annual average)
In 2023, the population of males grew slightly faster than the population of females. However, female labour force and employment growth was slightly faster than for males. Unemployment was down for males and up slightly for females.

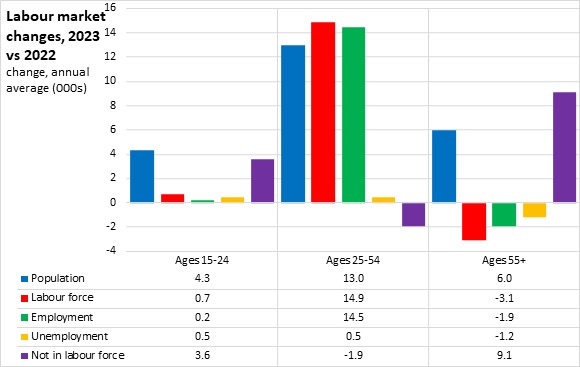
Across broad age cohorts, the largest increases in labour force and employment were reported among the core working age (25-54) - this age cohort also has much larger population than youth (15-24) or older workers (55+). Among youth the increase in population was larger than the rise in labour force and employment. Youth also saw a rise in the number of unemployed and a larger rise in the number of youth not in the labour force. The population of older workers rose in 2023 while labour force, employment and unemployment declined, and the number of persons not in the labour force rose (persons not in the labour force includes retirees).
Within specific age cohorts, the increase in labour force and employment for youth was due to increases in the 20-24 age cohort. Persons not in the labour force increased for both the 15-19 and 20-24 age cohorts.

Cohorts from 25 to 49 years old all reported strong gains in population, labour force and employment. Unemployment declined for those aged 30-34 on stronger employment growth. Labour force gains outpaced employment for those aged 25-29 and 35-49 resulting in higher unemployment for those age groups. Persons not in the labour force declined for those aged 30-39.

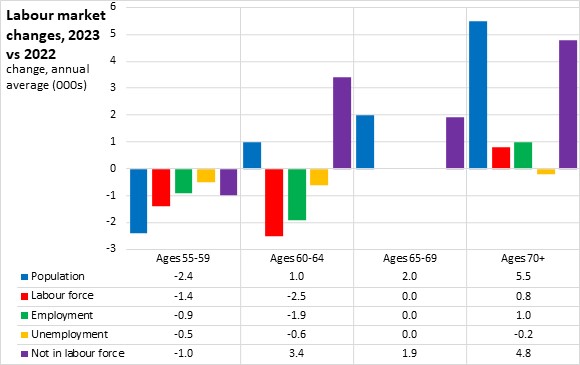
Those aged 50-59 reported a smaller population, with labour force declining faster than employment. Cohorts aged 60 and over reported population increases and a rise in the number of people not in the labour force.
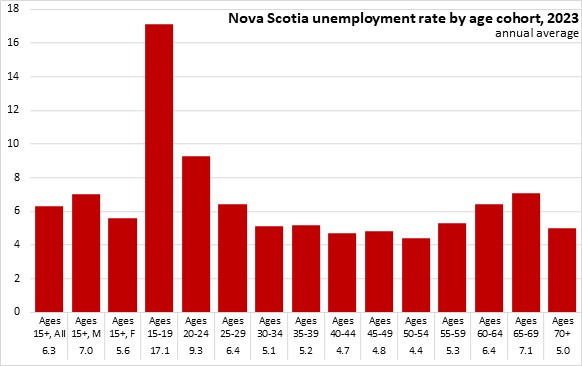
Unemployment rates in 2023 were higher for younger cohorts and lowest for those in the middle of the core working ages. Males (aged 15+) had higher unemployment rates compared to females of the same age.
Participation rates were highest for those aged 25-54. Participation rates were similar for those aged 20-24 and 55-59. Participation rates are lower for those over age 60 as well as those under 20. Males had higher participation rates than females.
As with participation rates, employment rates were highest for those aged 25-54. Like participation rates, employment rates were similar for those aged 20-24 and 55-59, but fall off substantially for those over age 60 and under age 20. As with participation rates, males had higher employment rates than females in 2023.
Class of worker and industry (2023 vs 2022, annual average)
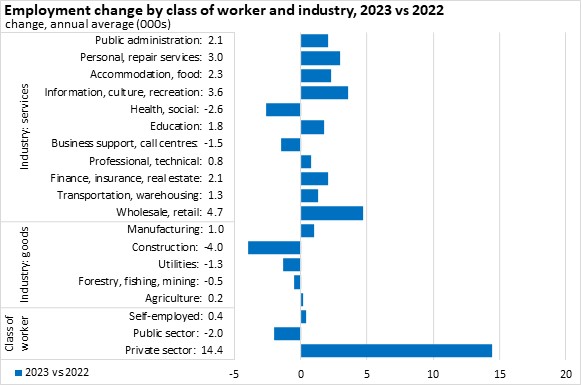
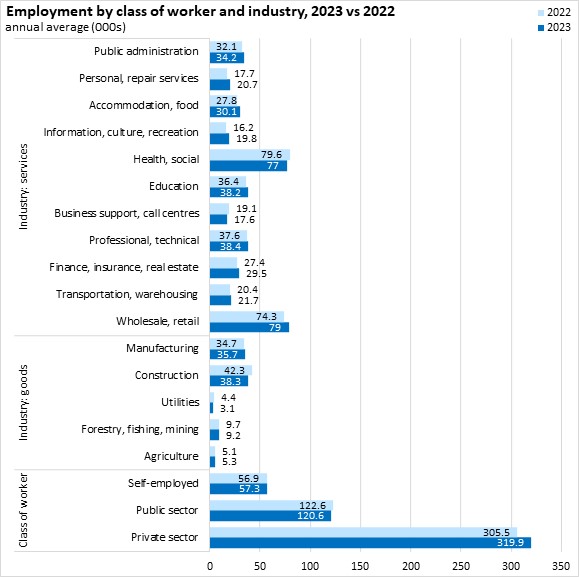
Nova Scotia's annual employment increase was primarily due to higher private sector employment (+14,400). Self employment was up by 400, while public sector employment declined by 2,000 in 2023.
Among industries, the rise in annual employment was concentrated in service industries. The largest increase was in wholesale/retail, followed by information/culture/recreation, personal/repair services, accommodation/food services and public administration. There were notable employment declines for construction and health care/social assistance (including daycare).
Wholesale/retail and health/social assistance remain the largest broad industries of employment in Nova Scotia, followed by professional/technical services, construction, education, manufacturing, public administration and accommodation/food.
Hours worked (2023 annual average)
A larger portion of workers in services industries had part-time hours (less than 40 hours/week).

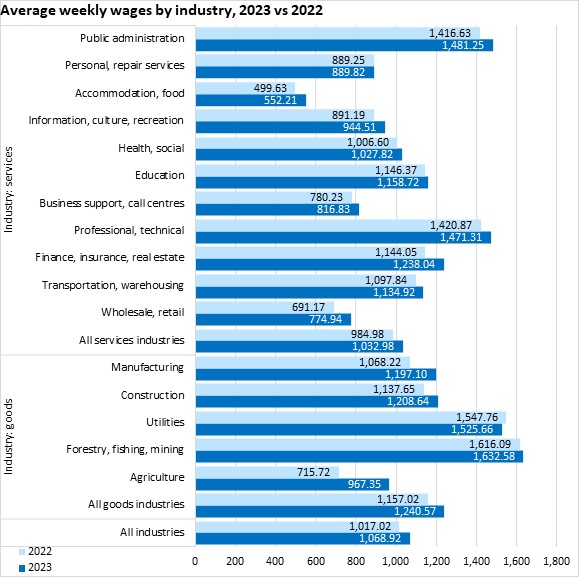
Average weekly wages (2023 vs 2022, annual average)
Nova Scotians' average weekly earnings amounted to $1,068.92 in 2023, up from $1,017.02 in 2022. Average weekly wages were highest in forestry/fishing/mining, utilities, public administration and professional/technical services. The lowest average weekly earnings were reported in accommodation/food, wholesale/retail, business support/call centres and agriculture.
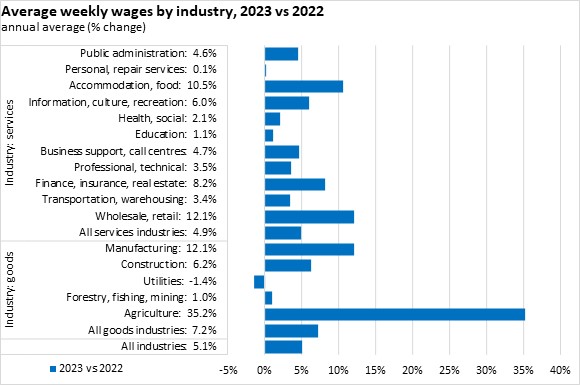
Average weekly earnings were up 5.1% from 2022 to 2023. Agriculture reported the largest increase in annual average weekly earnings due to an atypically low level in September 2022 and atypically high levels in September and October 2023. There were other notable increases in earnings for manufacturing, wholesale/retail, accommodation/food, and finance/insurance/real estate. Utilities reported the only decline in average weekly earnings over 2022.
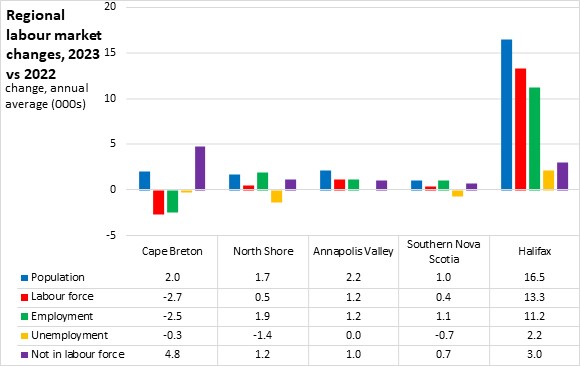
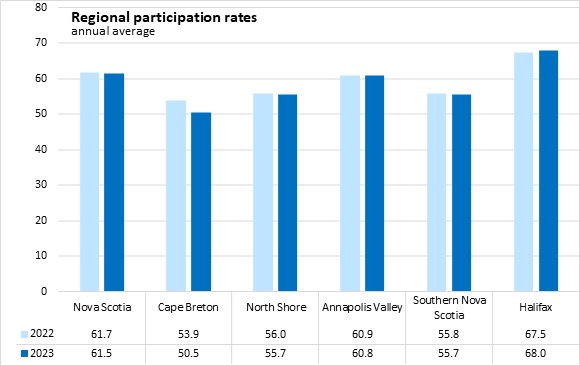
Regions (2023 vs 2022, annual average)
All regions reported increases in population of working age. Labour force was up in every region except Cape Breton, where labour force and employment both declined. A faster decline in the labour force resulted in a decline in unemployment for Cape Breton. Faster increases in employment in North Shore and Southern regions resulted in lower unemployment in 2023. Annapolis Valley region saw equal increases in labour force and employment on average in 2023. Halifax’s labour force growth outpaced employment growth, resulting in higher unemployment in 2023.
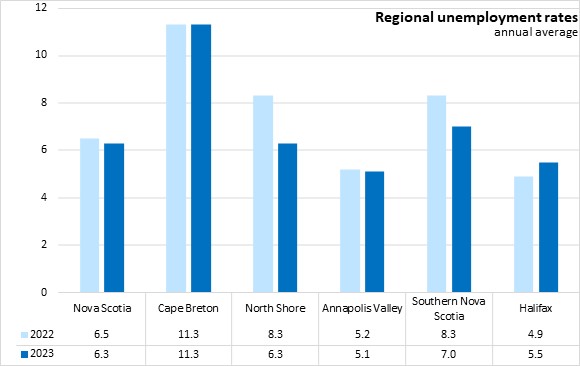
Unemployment rates were down in 2023 in the North Shore, Annapolis Valley and Southern regions. The unemployment rate rose in Halifax and was unchanged in Cape Breton. The Annapolis Valley reported the lowest unemployment rate on average in 2023, followed by Halifax, while Cape Breton reported the highest.
Participation rates were down overall in Nova Scotia in 2023. Participation rates declined in every region except Halifax, where it rose in 2023. Halifax reported the highest annual average participation rate in 2023. Cape Breton reported the lowest participation rate.
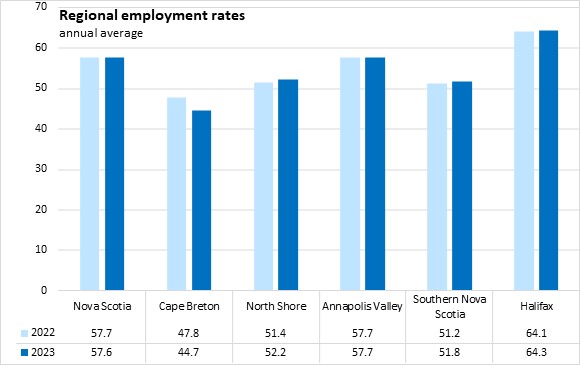
Employment rates were up in Halifax, Southern and North Shore economic regions. The annual average employment rate in the Annapolis Valley was unchanged in 2023. Cape Breton reported the only region with a declining employment rate. Halifax and the Annapolis Valley reported the highest employment rates while Cape Breton reported the lowest (less than 50%).
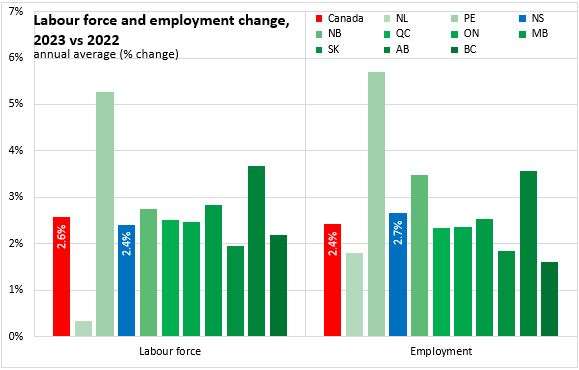
Provinces (2023 vs 2022, annual average)
Nova Scotia's labour force increase of 2.4% was slower than the national gain of 2.6%. Labour force was up in all provinces with the fastest rise in Prince Edward Island and the slowest in Newfoundland and Labrador.
Nova Scotia's employment gain of 2.7% was just faster than the national pace of 2.4%. All provinces reported rising employment with the fastest gains in Prince Edward Island and Alberta.
The national unemployment rate averaged 5.4% in 2023, up slightly from 5.3% reported in 2022. Unemployment rates were down in the Atlantic provinces while every other province reported higher unemployment rates over 2022. Nova Scotia's unemployment rate fell 0.2 percentage points to 6.3%. Quebec reported the lowest average unemployment rate in 2023 while Newfoundland and Labrador reported the highest.

Labour force participation rates were up in five provinces from 2022 to 2023. The national participation rate was 65.6%, up from 65.4% in 2022. Nova Scotia's participation rate was third lowest among the provinces in 2023, following Newfoundland and Labrador and New Brunswick. The highest participation rates were in Alberta and Saskatchewan.

Employment rates increased in five provinces from 2022 to 2023. Nova Scotia's employment rate edged down by 0.1 percentage points to 57.6% while the national average increased by 0.1 percentage points to 62.1%. Alberta and Saskatchewan reported the highest employment rates in 2023; Newfoundland and Labrador reported the lowest.

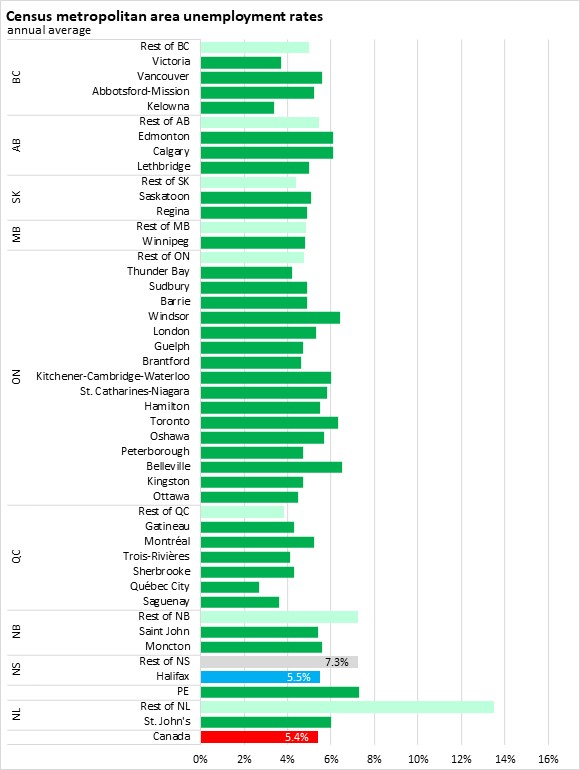
Census Metropolitan Areas (2023, annual average)
The Halifax unemployment rate averaged 5.5% in 2023. This was just above the national average and lower than in the rest of Nova Scotia (7.3%). In central and western provinces, unemployment rates in Census Metropolitan Areas are similar to or higher than unemployment rates outside CMAs. In the Atlantic Provinces unemployment rates are typically higher outside CMAs.
Halifax's participation rate was 68.0% on average in 2023 while participation rates were 55.6% across the rest of the province. Only Newfoundland and Labrador outside St. John's reported a lower participation rate than Nova Scotia outside of Halifax.

Halifax reported an employment rate of 64.3% on average in 2023 while the employment rate was 51.6% outside the city. Only Newfoundland and Labrador outside St. John's reported a lower employment rate than Nova Scotia outside of Halifax.

Sources: Statistics Canada. Table 14-10-0037-01 Actual hours worked by industry, annual; Table 14-10-0064-01 Employee wages by industry, annual; Table 14-10-0327-01 Labour force characteristics by sex and detailed age group, annual; Table 14-10-0385-01 Labour force characteristics, annual; Table 14-10-0393-01 Labour force characteristics, annual; Table 14-10-0023-01 Labour force characteristics by industry, annual (x 1,000); Table 14-10-0027-01 Employment by class of worker, annual (x 1,000)
<--- Return to Archive