The Economics and Statistics Division maintains archives of previous publications for accountability purposes, but makes no updates to keep these documents current with the latest data revisions from Statistics Canada. As a result, information in older documents may not be accurate. Please exercise caution when referring to older documents. For the latest information and historical data, please contact the individual listed to the right.
<--- Return to Archive
For additional information relating to this article, please contact:
April 26, 2024CANADIAN INCOME SURVEY: INCOME DISTRIBUTION, 2022 Median incomes
Median incomes are the level of income at which half the population had higher income and half had lower income. Median incomes are frequently used in making income comparisons because, unlike averages, they are not influenced by outliers with very high values.
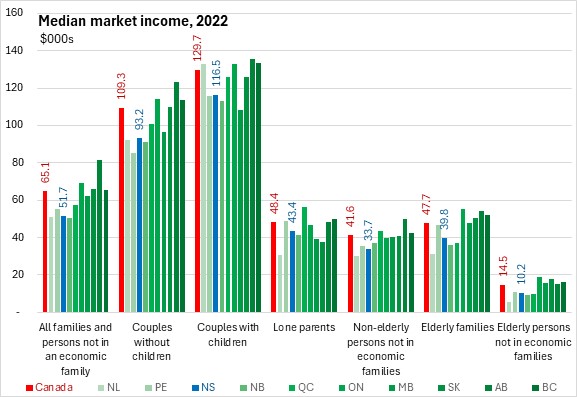
The median market income for all Nova Scotians (whether in an economic family or not) in 2022 was $51,700. However, with more than one potential earner, median market incomes are substantially higher for couple families: $93,200 for couple families without children and $116,500 for couple families with children. Median market incomes for Nova Scotia's lone parents ($43,400) were higher than for non-elderly persons not in an economic family ($33,700). As many elderly persons are retired, their dependence on market sources of income is lower.
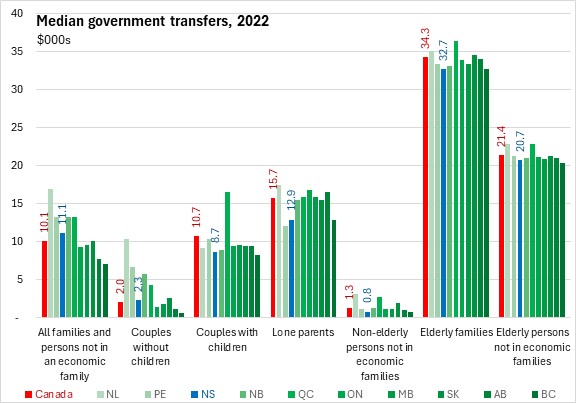
Households don't just rely on market sources for income. Government transfers such as Canada Pension Plan, Employment Insurance and Canada Child Benefit also make up a substantial part of household total income.
Median government transfers for Nova Scotians were $11,100 in 2022. Elderly families ($32,700) and elderly persons not in economic families ($20,700) reported the highest median government transfers, followed by lone parents ($12,900) and couple families with children ($8,700). Couple families without children and non-elderly persons not in economic families reported much lower median government transfers.
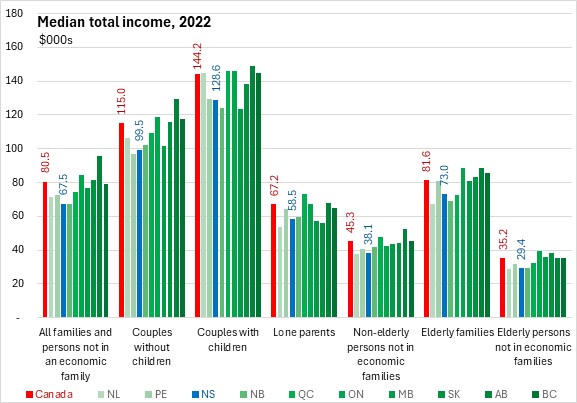
Total income includes market income and government transfers.
Median total income for all persons (whether in economic families or not) was $67,500 in 2022. Couple families without children ($99,500) and with children ($128,600) reported the highest median total incomes owing to their higher median market incomes. Elderly families ($73,000) and lone parent families ($58,500) reported the next highest median total incomes reflecting combined effects of market incomes and government transfers. Persons not in economic families reported the lowest median total incomes ($38,100 for non-elderly persons not in economic families and $29,400 for elderly persons not in economic families).
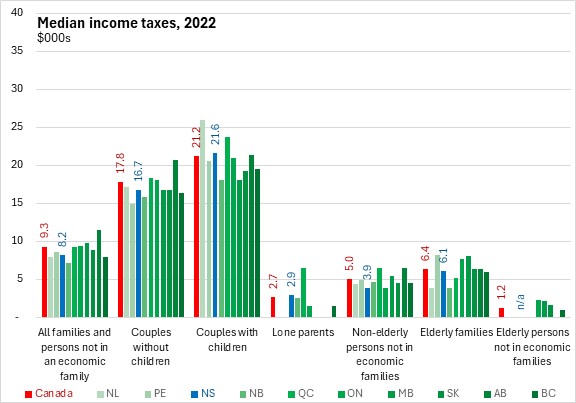
Government income taxes reduce disposable income available for household spending.
Median income taxes were $8,200 for all Nova Scotians. This was higher for those in couple families (with or without children).
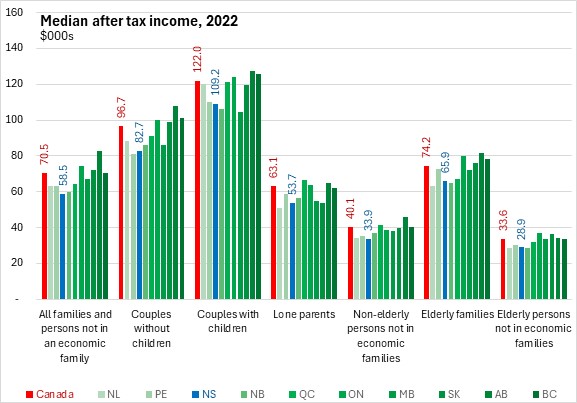
Median after-tax income was $58,500 in Nova Scotia. Couple families with children ($109,200) reported the highest median after tax incomes, followed by couple families without children ($82,700), elderly families ($65,900) and lone parent families ($53,700). Median after tax incomes were substantially lower for persons not in economic families ($33,900 for non-elderly persons not in economic families and $28,900 for elderly persons not in economic families).
Income distribution
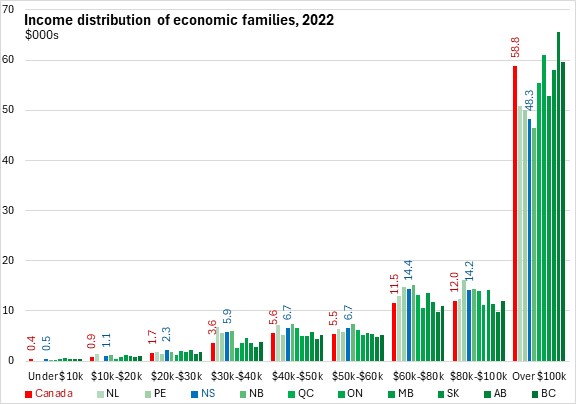
Among economic families, 48.3% of Nova Scotian families had income above $100,000 in 2022 (58.8% nationally). A further 28.6% reported incomes between $60,000 and $100,000 (23.5% nationally) while 13.4% reported incomes between $40,000 and $60,000 (11.1% nationally). A total of 9.8% of Nova Scotia economic families reported income under $40,000 (6.6% nationally).
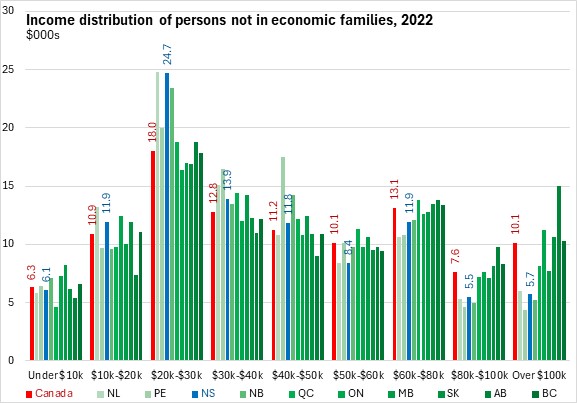
The distribution of income is notably different among persons not in an economic family. Just 5.7% of Nova Scotians not in an economic family reported income over $100,000 (10.1% nationally). Another 17.4% reported income between $60,000 and $100,000 (20.7% nationally) along with 20.2% that reported income between $40,000 and $60,000 (21.3% nationally). Among Nova Scotians not in an economic family, 38.6% reported incomes between $20,000 and $40,000 (30.8% nationally) while 18.0% (17.2% nationally) reported income under $20,000 in 2022.
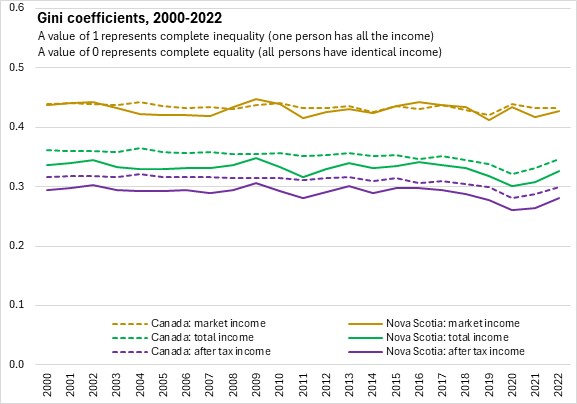
Gini coefficient of income distribution
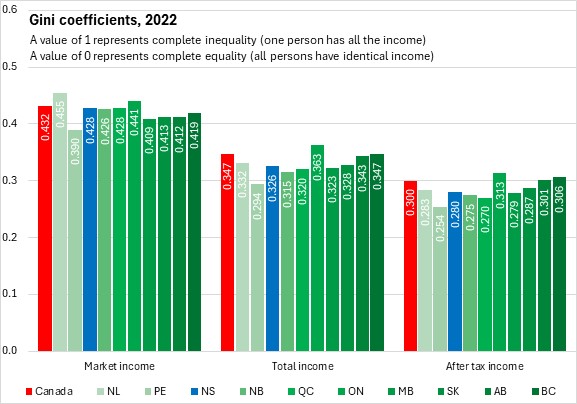
The Canadian Income Survey also reports the Gini coefficient measure of income distribution. Gini coefficients range between zero (representing perfect equality in which all individuals have the same income) and one (representing perfect inequality in which only one person has all the income while others have none). A higher Gini coefficient means greater income inequality.
Gini coefficients can be measured for market income, total income (market income plus transfers) and after-tax income (total income less taxes).
By any income measure, Nova Scotia's Gini coefficient was below the national Gini coefficient, reflecting a more equal distribution of income (whether market, total or after-tax income).
For market income, Newfoundland and Labrador had the highest Gini coefficient (most inequality) while Prince Edward Island had the lowest Gini coefficient (most equality).
For both total income and after-tax income, Ontario had the highest Gini coefficients (most inequality) while Prince Edward Island had the lowest Gini coefficients (most equality).
Income inequality decreased from 2016 to 2019 at both the national and Nova Scotia levels. This has been mainly caused by greater income equality in market sources. However, in 2020, Gini coefficients increased for market income (both provincially and at the national level) while total and after-tax inequality measures declined. This is due to the role of employment loss in low-wage occupations and extraordinary government transfers during the pandemic in 2020.
In 2021, market Gini coefficients declined while the total and after-tax Gini coefficients rose. In 2022, Gini coefficients for total, market and after-tax income increased in Nova Scota. Nationally, total and after-tax measures of inequality increased while the Gini coefficient for market income was unchanged.
Notes and definitions
The median is the level of income at which half the population had higher income and half had lower. Income estimates are expressed in 2018 constant dollars to factor in inflation and enable comparisons across time in real terms.
After-tax income is the total of market income and government transfers, less income tax.
Market income consists of employment income and private pensions, as well as income from investments and other market sources.
Government transfers include benefits such as Old Age Security, the Guaranteed Income Supplement, the Canada Pension Plan and the Quebec Pension Plan, Employment Insurance, social assistance, the goods and services tax credit, provincial tax credits, and various types of child benefits.
Sources: Statistics Canada, Canadian Income Survey. Table 11-10-0134-01 Gini coefficients of adjusted market, total and after-tax income; Table 11-10-0190-01 Market income, government transfers, total income, income tax and after-tax income by economic family type; Table 11-10-0237-01 Distribution of market, total and after-tax income by economic family type, Canada, provinces and selected census metropolitan areas (CMAs)
<--- Return to Archive