For additional information relating to this article, please contact:
November 29, 20172016 CENSUS: EDUCATION Results from the 2016 Census released today highlight the levels of education across the population, including highest level of education attained, major field of study of education, average/median employment earnings, labour market outcomes (such as employment rate). These results are available for detailed geographic levels as well as age/sex cohorts and
HIGHEST LEVEL OF EDUCATION
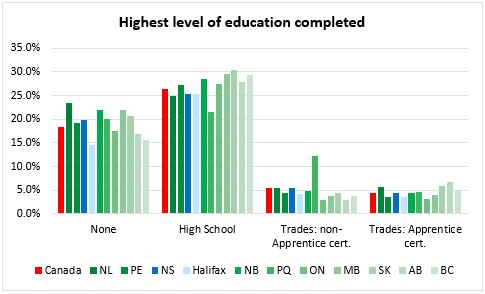
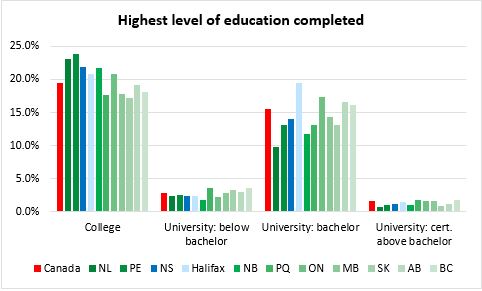
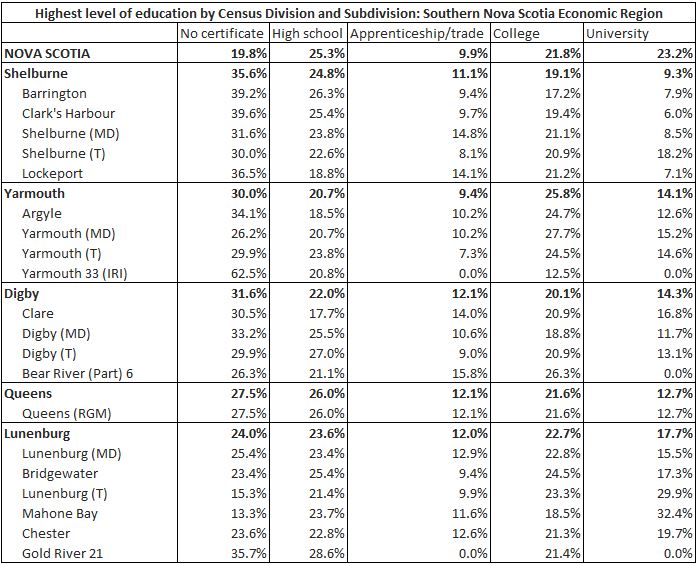
The largest cohort by education level in Nova Scotia is those with a secondary (high school) certificate or equivalent at 25.3 per cent of the population. A further 21.8 per cent of Nova Scotians reported a college diploma. Those with a university education at the bachelors level and above amouted to 20.8 per cent of the Nova Scotia population with a further 2.4 per cent with a university certificate below the bachelors level. 9.9 per cent had apprenticeship or trades certificates. Nova Scotians without any certificate made up 19.8 per cent of the population.
In comparison with the rest of Canada, there were a higher share of Nova Scotians with no certificate or degree (this share was much lower in Halifax). There is a higher share of college graduates among the population in both Halifax and the rest of the province when compared with the national average. The share of university graduates in Nova Scotia is also below the national average, but higher at all degree levels in Halifax.

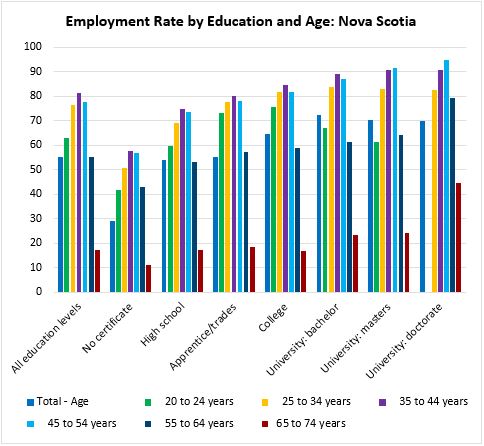
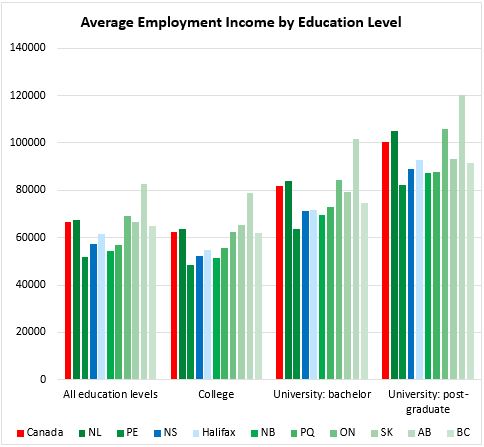
Those with higher levels of education report higher employment levels for all age cohorts. In addition, those with higher education levels in Nova Scotia also report higher employment rates among older workers.
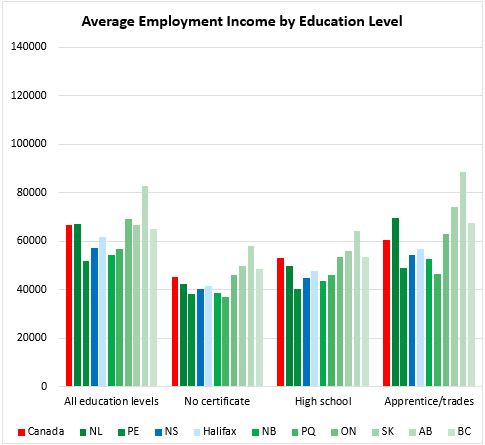
Average earnings rise with education levels, though the gap between national average employment income and Nova Scotia average employment income persists for all education levels.


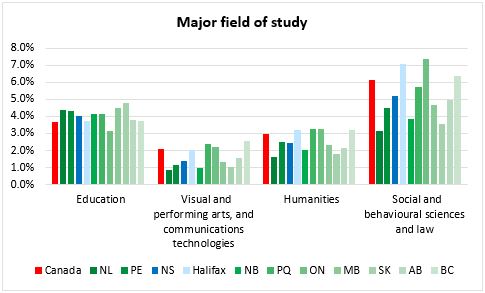
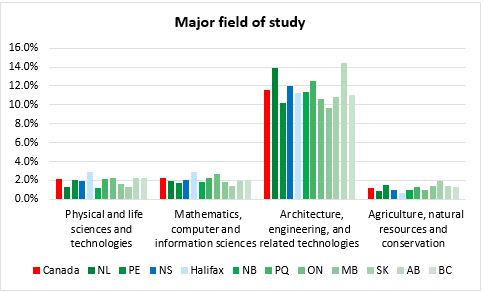
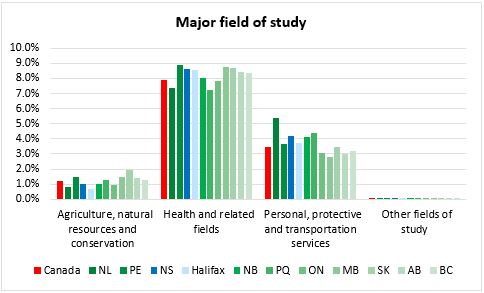
MAJOR FIELD OF STUDY
In Nova Scotia, 45.1 per cent of the population reported that they did not have a major field of study in their education, particularly among those who do not hae post secondary qualifications. The figure was 44.7 per cent for Canada and 40.1 per cent for Halifax. Among those with major fields of study, the largest fields studied were busines/finance/public administration (12 per cent) as well as architecture/engineering/technology (12 per cent). This was followed by health care (8.6 per cent) and social/behavioural sciences (5.2 per cent).
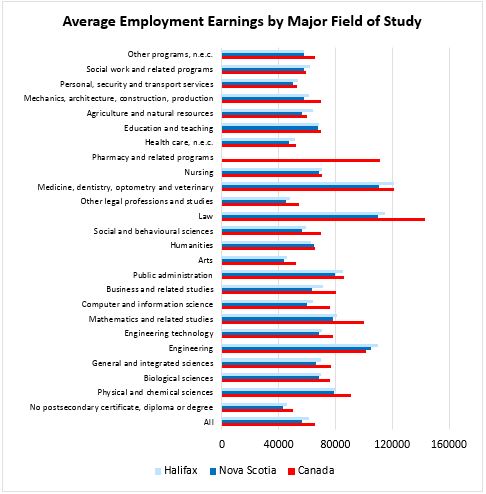
Average employment income by major field of study varies, with the highest earnings in law, medicine/dental/optometry/veterinary (including residents) followed by engineering and pharmacy (no provincial data available). National average earnings in mathematics and physical sciences were also relatively high, but the gap between provincial and national earnings was larger.
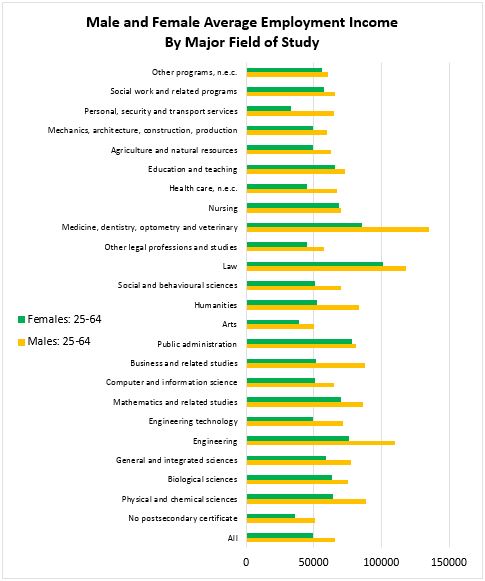
There are also gaps in average employment earnings between males and females for each major field of study. This is a national phenomenon that is also observed in Nova Scotia in the chart below. Looking at average employment earnings among males and females aged 25-64 across each major field of study, the largest gaps are between men and women educated in personal/security/transport services, business, humanities and medicine/dentistry/optometry/veterinary. The gaps between male and female earnings in Nova Scotia is notably higher than the national gap in all of these fields except for business. The Nova Scotia gap between male and female average employment income is also higher than the national gap for those who studied engineering and for those studied in the arts.
Although there were no fields of study in which average female employment income exceeded average male employment income, the narrowest gaps were in nursing, public administration and education (as well as other programs).
Source: Statistics Canada, 2016 Census - Education