For additional information relating to this article, please contact:
October 17, 2018MANUFACTURING SHIPMENTS, AUGUST 2018 Nova Scotia
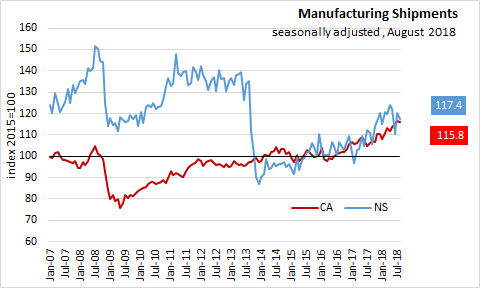
In Nova Scotia August 2018, seasonally adjusted Manufacturing Shipments decreased 2.3% to $754.3 million over July 2018 and increased 5.9% over August 2017.
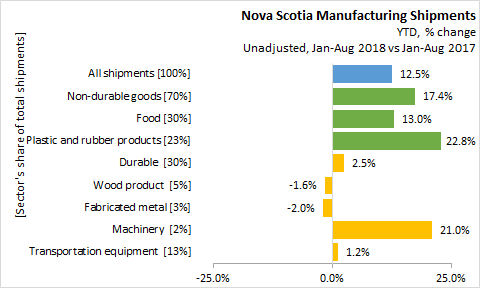
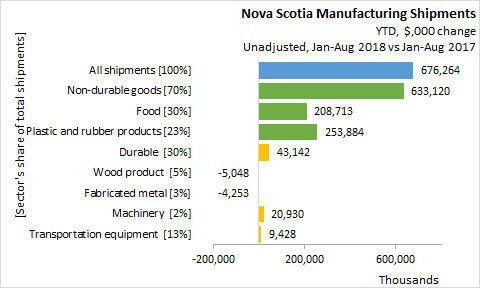
Unadjusted year-to-date (Jan-Aug 2018), Manufacturing Shipments increased 12.5% ($676.3 million) over the same period last year.
- Non-durable goods shipments, accounting for 70% of Manufacturing Shipments, increased 17.4% ($633.1 million),
- Food with a 30% share increased 13.0% ($208.7 million),
- Plastic and rubber products with a 23% share increased 22.8% ($253.9 million).
- Durable manufacturing, accounting for 30% of Manufacturing Shipments, increased 2.5% ($43.1 million).
- Wood product with a 5% share decreased 1.6% (-$5.0 million).
- Fabricated metal with a 3% share decreased 2.0% (-$4.3 million).
- Machinery with a 2% share increased 21.0% ($20.9 million).
- Transportation equipment with a 13% share increased 1.2% ($9.4 million).
CANADA
In Canada August 2018, seasonally adjusted Manufacturing Shipments decreased 0.4% to $58.6 billion over July 2018 and increased 9.0% over August 2017.
Compared to July 2018, overall sales decreased in 7 of 21 industries representing 50.9% of all manufacturing sectors.
Durable goods decreased 1.2% to $30.6 billion over July 2018 and increased 6.2% over August 2017.
Non-durable goods increased 0.5% to $28.0 billion over July 2018 and increased 12.2% over August 2017.

Inventory levels increased with 1.1% growth in August 2018 to $83.9 billion.
The inventory to sales ratio increased from 1.41 to 1.43.
Unfilled orders increased 0.8% to $94.8 billion mostly due to aerospace product and parts industry.
New orders increased 1.1% to $59.3 billion.
PROVINCES
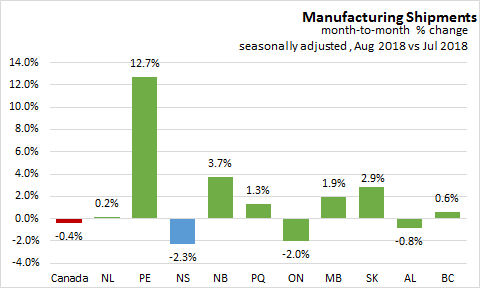
On a seasonally adjusted, month-over-month basis, Manufacturing sales increased in 7 provinces in August 2018 over July 2018. Prince Edward Island had the largest growth at 12.7% Nova Scotia shipments decreased -2.3%. In Canada shipments decreased -0.4%.
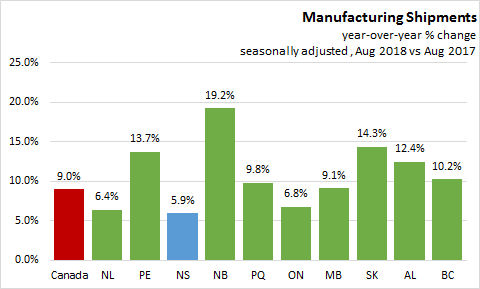
On a seasonally adjusted year-over-year basis, Manufacturing sales increased in all provinces in August 2018 over August 2017. New Brunswick had the largest growth at 19.2%. Nova Scotia shipments ncreased 5.9%. In Canada shipments increased 9.0%.
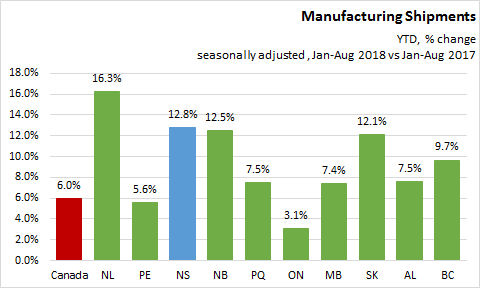
On a seasonally adjusted, year-to-date basis, manufacturing shipments growth was positive in all provinces in Jan-Aug 2018. Newfoundland and Labrador had the largest growth at 16.3%. Ontario shipments grew only increased 3.1%. Nova Scotia shipments increased 12.8%. In Canada shipments increased 6.0%.
YEAR-TO-DATE UNADJUSTED DATA
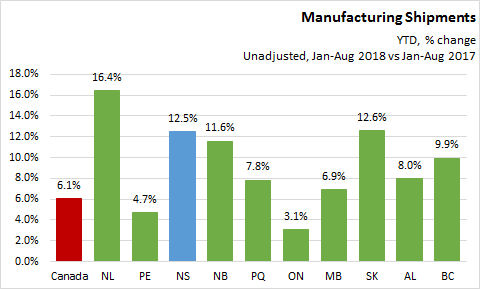
On an unadjusted year-to-date basis, manufacturing shipments growth was positive in all provinces. In Canada shipments increased 6.1%. Nova Scotia shipments increased 12.5%.
SOURCES
Statistics Canada Monthly survey of Manufacturing, July 2018
Table 16-10-0047-01 Manufacturers' sales, inventories, orders and inventory to sales ratios, by industry (dollars unless otherwise noted)
Table 16-10-0048-01 Manufacturing sales by industry and province, monthly (dollars unless otherwise noted) (x 1,000)