For additional information relating to this article, please contact:
June 04, 2020NOVA SCOTIA - INTERNATIONAL MERCHANDISE TRADE APRIL 2020 Year-over-year (April 2020 vs April 2019, customs based, unadjusted)
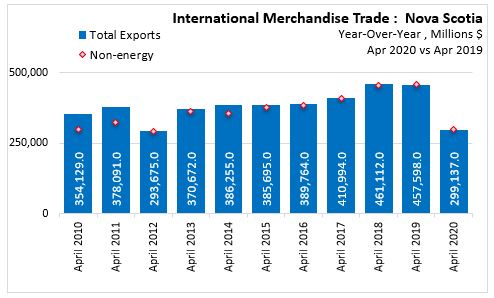
In April 2020, Nova Scotia International Merchandise Trade Exports decreased 34.6% ($158.5 million) over April 2019, to $299.1 million.
Year-over-year - By Sector
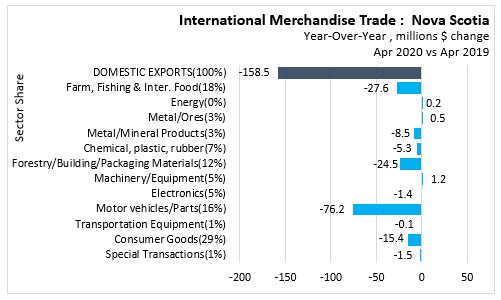
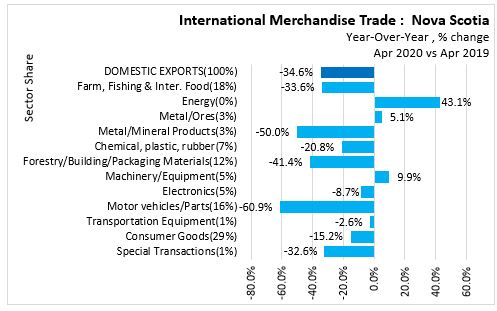
Comparing Nova Scotia's exports for April 2020 with the same period last year, the largest dollar value increases were in Machinery/Equipment ($1.2 million) and Metal/Mineral Products ($0.5 million). The largest dollar value decreases were in Motor vehicles/Parts (-$76.2 million), Farm, Fishing & Inter. Food (-$27.6 million), Forestry/Building/Packaging Materials (-$24.5 million), and Metal/Ores (-$15.4 million).
Year-over-year by Province
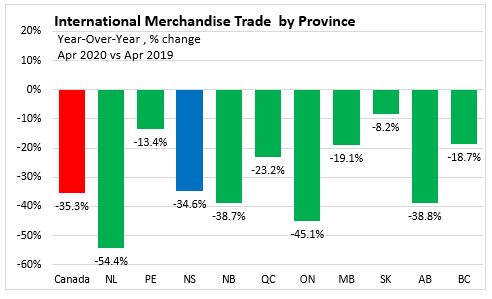
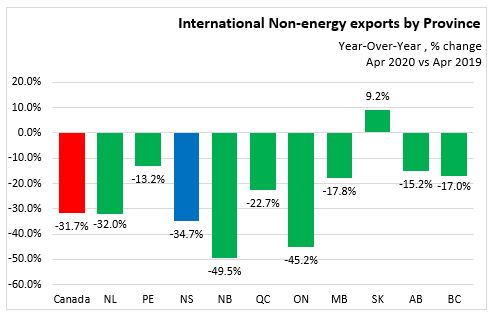
In April 2020 Saskatchewan reported the lowest decline (8.2%), while Newfoundland and Labrador reported the highest decline (54.4%) in merchandise trade exports over April 2019. Nova Scotia reported a 34.6% loss in merchandise trade exports. Canada reported a 35.3% loss in merchandise trade exports over April 2019.
Excluding energy exports, Saskatchewan reported the highest increase (9.2%) while New Brunswick reported the highest decline (49.5%) in Non-energy exports over April 2019. Nova Scotia reported a 34.7% loss in Non-energy exports. Canada reported a 31.7% loss in Non-energy exports over April 2019.
YEAR-OVER-YEAR EXPORTS BY INTERNATIONAL DESTINATION
By Commodity
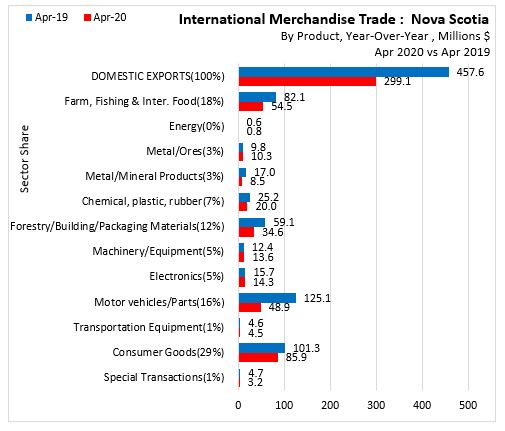
In Nova Scotia April 2020, international export trade to all countries decreased 34.6% to $299.1 million over April 2019.
- Consumer Goods led the way with a value of $85.9 million (28.7% share), followed by
- Farm, Fishing & Inter. Food with a value of $54.5 million (18.2% share),
- Motor vehicles/Parts with a value of $48.9 million (16.4% share),
- Forestry/Building/Packaging Materials with a value of $34.6 million (11.6% share),
- Chemical, plastic, rubber with a value of $20.0 million (6.7% share),
- Electronics with a value of $14.3 million (4.8 % share),
- Machinery/Equipment with a value of $13.6 million (4.5% share),
- Metal/Ores with a value of $10.3 million (3.5 % share),
- Metal/Mineral Products with a value of $8.5 million (2.8% share),
- Transportation Equipment with a value of $4.5 million (1.5% share),
- Special Transactions with a value of $3.2 million (1.1% share), and ,
- Energy with a value of $0.8 million (0.3% share).
By Trading Partner

In North America, April 2020 vs April 2019, year-over-year export trade to the United States decreased 35.1% (-$108.7 million) to $201.4 million. Mexico decreased 70.7% (-$4.3 million) to $1.8 million.

In Asia, April 2020 vs April 2019, year-over-year export trade to China decreased 39.5% (-$24.0 million) to $36.8 million. Japan down 15.7% (-$0.7 million) to $3.5 million. South Korea down 9.9% (-$0.6 million) to $5.5 million. Hong Kong down 61.3% (-$2.5 million) to $1.6 million. India down 72.4% (-$3.1 million) to $1.2 million. Taiwan down 60.6% (-$0.5 million) to $0.3 million. Indonesia down 93.1% (-$0.4 million) to $0.03 million. Singapore down 94.8% (-$2.6 million) to $0.1 million.
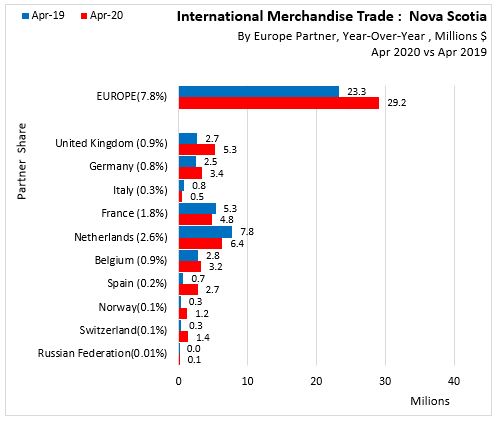
In Europe, April 2020 vs April 2019, year-over-year export trade to the United Kingdom down 49.0% (-$2.6 million) to $2.7 million. Germany down 26.5% (-$0.9 million) to $2.5 million. Italy up 50.4% ($0.3 million) to $0.8 million. France up 10.5% ($0.5 million) to $5.3 million. Netherlands up 22.6% ($1.4 million) to $7.8 million. Belgium down 13.2% (-$0.4 million) to $2.8 million. Spain down 75.0% (-$0.9 million) to $0.7 million. Norway down 75.5% (-$0.9 million) to $0.3 million. Switzerland down 74.6% (-$1.0 million) to $0.3 million. Russian Federation down 81.1% (-$0.1 million) to $0.02 million.

In other counbtries, April 2020 vs April 2019, year-over-year export trade to Brazil down 58.5% (-$0.8 million) to $0.5 million. Peru up 314.3% ($0.04 million) to $0.1 million. Peru up $0.04 million to $0.06 million. Algeria was up $0.03 million to $0.03 million. Saudi Arabia down 32.3% (-$0.01 million) $0.02 million. Turkey down 91.4% (-$3.1 million) to $0.3 million. Iraq down 100.0% (-$1.0 million) to zero trade. Australia down 0.1% (-$0.001 million) to $0.85 million. The other countries Residual down 2.1% (-$0.5 million) to $21.7 million.
12-10-0119-01 International merchandise trade: Nova Scotia sectors
12-10-0119-01 International merchandise trade: by province and commodity
12-10-0119-01 International merchandise trade: by province and energy commodity
12-10-0119-01 International merchandise trade: by province, commodity, trading partners
Trading partners group 1: All, US, China
Trading partners group 2: Japan et al
Trading partners group 3: UK et al
Trading partners group 4: Mexico et al