For additional information relating to this article, please contact:
August 05, 2020NOVA SCOTIA - INTERNATIONAL MERCHANDISE TRADE JUNE 2020 Year-over-year (Jun 2020 vs Jun 2019, customs based, unadjusted)
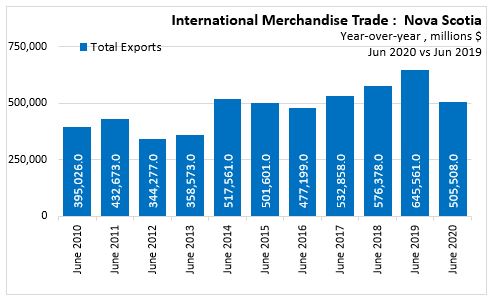
In June 2020, Nova Scotia International Merchandise Trade Exports decreased 21.7% (-$140.1 million) over June 2019, to $505.5 million.
Year-over-year - By Sector
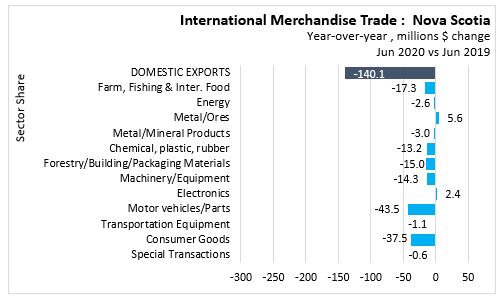
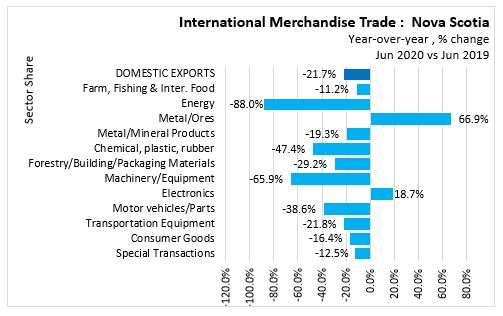
Comparing Nova Scotia's exports for June 2020 with the same period last year, all sectors were in decline, except Metal/Ores, and electronics Two sectors reported positive dollar value growth: Metal/Ores (+$5.6 million) and Electronics (+$2.4 million).on). The largest dollar value declines were in Motor vehicles/Parts (-$43.5 million), Consumer Goods (-$37.5 million), and Farm, Fishing and Inter. Food (-$17.3 million).
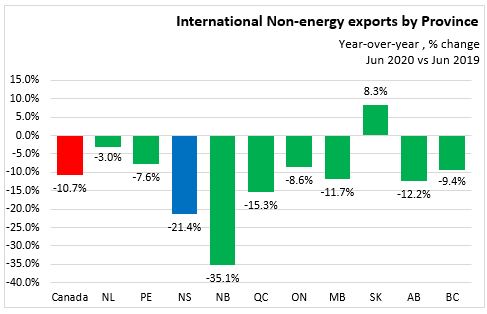
Year-over-year by Province
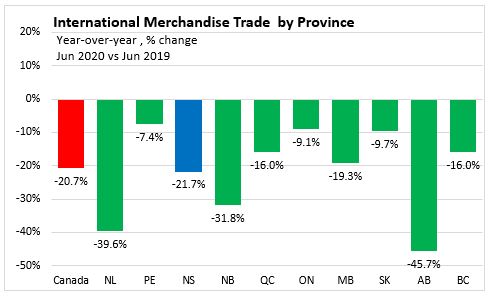
In June 2020 Prince Edward Island reported the lowest decline (-7.4%), while Alberta reported the highest decline (-45.7%) in merchandise trade exports over June 2019. Nova Scotia reported a 21.7% decline in merchandise trade exports. Canada reported a 20.7% decline in merchandise trade exports, over June 2019.
Excluding energy exports, Saskatchewan reported the only increase (+8.3%) while New Brunswick reported the highest decline (-35.1%) in Non-energy exports over June 2019. Nova Scotia reported a 21.4% decline in Non-energy exports. Canada reported a 10.7% decline in Non-energy exports over June 2019.
YEAR-OVER-YEAR EXPORTS BY INTERNATIONAL DESTINATION
By Commodity
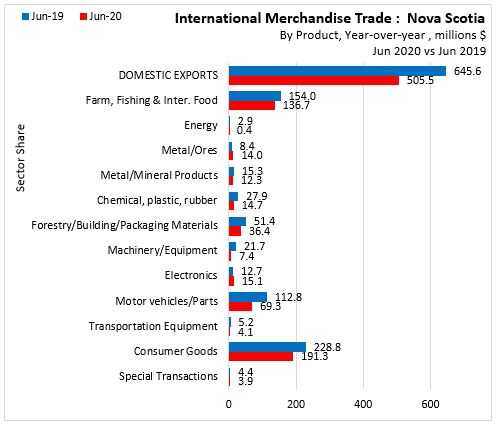
In Nova Scotia June 2020, international export trade to all countries decreased -21.7% to $505.5 million over June 2019.
- Consumer Goods led the way with a value of $191.3 million (37.8% share), followed by
- Farm, Fishing & Inter. Food with a value of $136.7 million (27.0% share),
- Motor vehicles/Parts with a value of $69.3 million (13.7% share),
- Forestry/Building/Packaging Materials with a value of $36.4 million (7.2% share),
- Electronics with a value of $15.1 million (3.0% share),
- Chemical, plastic, rubber with a value of $14.7 million (2.9% share),
- Metal/Ores with a value of $14.0 million (2.8% share),
- Metal/Mineral Products with a value of $12.3 million (2.4% share),
- Machinery/Equipment with a value of $7.4 million (1.5% share),
- Transportation Equipment with a value of $4.1 million (0.8% share),
- Special Transactions with a value of $3.9 million (0.8% share), and ,
- Energy with a value of $0.4 million (0.1% share).
By Trading Partner
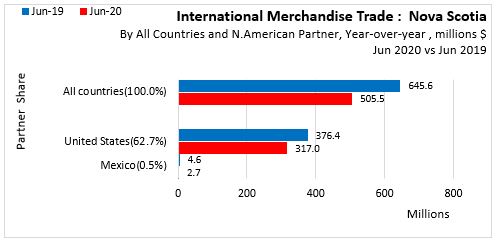
In North America, June 2020 vs June 2019, year-over-year export trade to United States decreased 15.8% (-$59.4 million) to $317.0 million. Mexico decreased 42.5% (-$2.0 million) to $2.7 million.
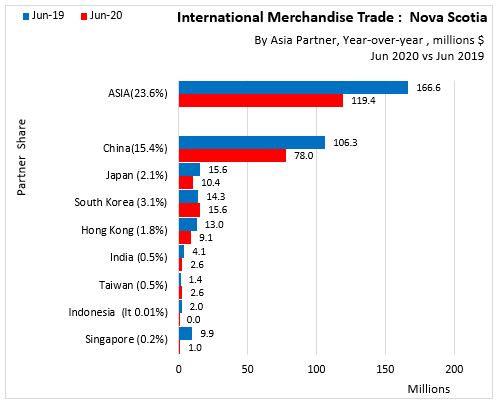
In Asia, June 2020 vs June 2019, year-over-year export trade to China decreased 26.7% (-$28.3 million) to $78.0 million; Japan down 33.2% (-$5.2 million) to $10.4 million; South Korea up 9.4% ($1.3 million) to $15.6 million; Hong Kong down 30.0% (-$3.9 million) to $9.1 million; India down 37.0% (-$1.5 million) to $2.6 million; Taiwan up 90.7% ($1.2 million) to $2.6 million; Indonesia down 98.7% (-$2.0 million) to $0.03 million; Singapore down 89.5% (-$8.9 million) to $1.0 million.
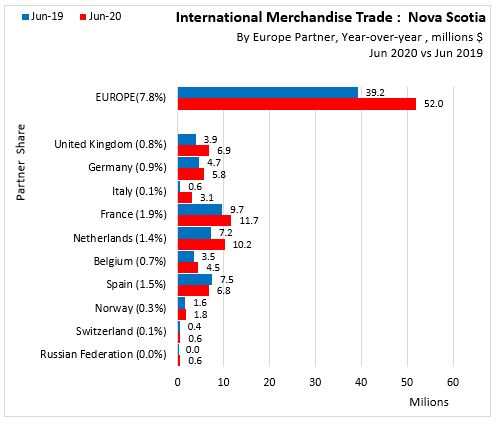
In Europe, June 2020 vs June 2019, year-over-year export trade to United Kingdom down 42.8% (-$2.9 million) to $3.9 million; Germany down 18.9% (-$1.1 million) to $4.7 million; Italy down 81.8% ($2.6 million) to $0.6 million; France down 17.1% (-$2.0 million) to $9.7 million; Netherlands down 29.1% (-$3.0 million) to $7.2 million; Belgium down 23.2% (-$1.0 million) to $3.5 million; Spain up 10.5% (+$0.1 million) to $7.5 million; Norway down 6.3% (-$0.1 million) to $1.6 million; Switzerland down 26.3% (-$0.2 million) to $0.4 million; Russian Federation down 93.0% (-$0.5 million) to $0.04 million.
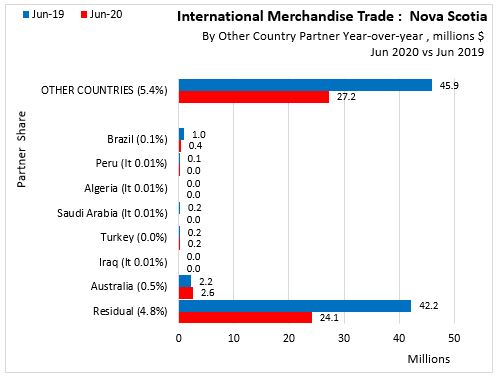
In other countries, June 2020 vs June 2019, year-over-year export trade to Brazil down 63.1% (-$0.6 million) to $0.4 million; Peru down 89.6% (-$0.121 million) to $0.014 million; Algeria no trade; Saudi Arabia no trade; Turkey up $0.001 million to $0.2 million; Iraq no trade; Australia up 14.4% ($0.322 million) to $2.6 million; Residual down 42.8% (-$18.1 million) to $24.1 million.
12-10-0119-01 International merchandise trade: Nova Scotia sectors
12-10-0119-01 International merchandise trade: by province and commodity
12-10-0119-01 International merchandise trade: by province and energy commodity
12-10-0119-01 International merchandise trade: by province, commodity, trading partners
Trading partners group 1: All, US, China
Trading partners group 2: Japan et al
Trading partners group 3: UK et al
Trading partners group 4: Mexico et al