For additional information relating to this article, please contact:
August 31, 2020NON-RESIDENTIAL FIXED CAPITAL INVESTMENT, Q2 2020 Non-residential fixed capital investment consists of expenditures made by business, governments and non-profit institutions serving households that add to the capital stock for production of goods and services in an economy. Investment that are included are buildings, engineering construction (i.e. bridge, mine structure), machinery and equipment, and intellectual property products (i.e. software, mineral exploration) but it doesn’t include non-reproducible assets (lands, mineral deposits, natural resources) or housing investment. Statistics Canada has begun to release quarterly data on non-residential fixed capital investment and stock for the provinces with historical data back to 2013. Note, the data is not seasonally adjusted and expressed in current prices.
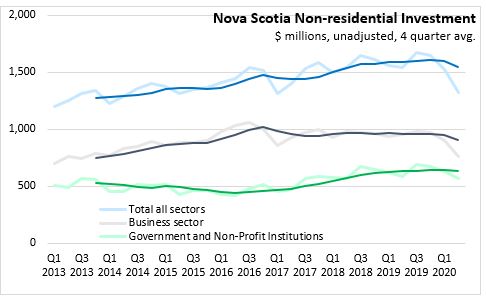
Nova Scotia non-residential investment has trended upwards since Q1 2013, rising from $1,201 million in Q1 2013 to $1,649 million in Q4 2019. Non-residential investment declined to $1,526 million in Q1 2020 and to $1,326 million in Q2. Business sector non-residential investment has declined to a greater extent in 2020 than in the government sector. Government and non-profit institution serving households was mostly flat from 2013 through 2017 but has been at higher level over 2018 and 2019.
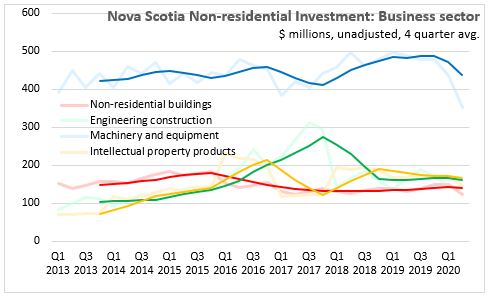
Within the business sector, machinery and equipment account for majority of fixed capital investments and declined by 28.4 per cent from Q2 2019 to $351 million in Q2 2020, the lowest level in the series back to 2013. Other categories of business investment have also declined compared to Q2 2019: buildings (-6.1%), engineering (-15.7%), and intellectual property products (-12.4%).
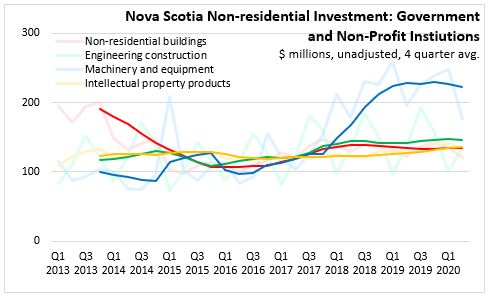
Government investment in machinery and equipment rose through 2018 and has maintained an elevated levels though 2019 at around $230 million per quarter. For Q2 2020, government and non-profit investment has declined 3.8 per cent with declines in buildings (-1.6%), engineering structures (-1.5%), and machinery and equipment (-10.2%) while intellectual property products is up 1.5 per cent.
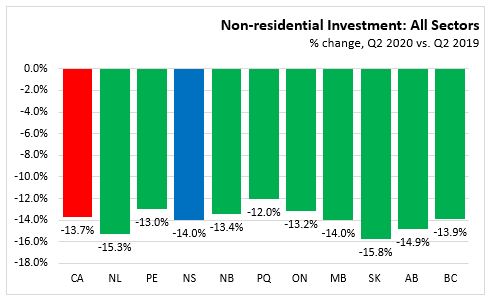
PROVINCES NON-RESIDENTIAL INVESTMENT: Q2 2020 vs. Q2 2019
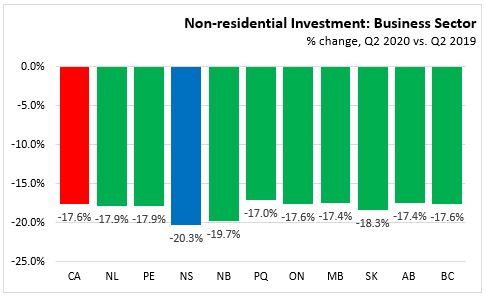
All provinces reported similar decreases in non-residential investment for Q2 2020 compared to Q2 2019.
Within the business sector, Nova Scotia (-20.3%) and New Brunswick (-19.7%) reported the largest declines. The smallest decline was in Quebec (-17.0%).
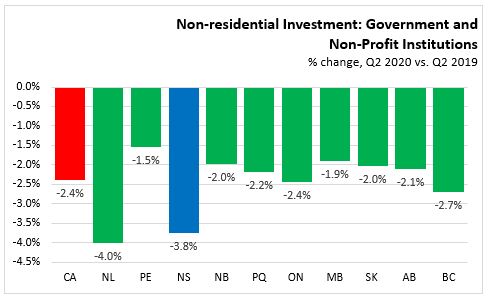
Government and non-profit fixed capital investment was also down in every province, but to a lesser extent than business investment. Canada had a decline of 2.4 per cent. Newfoundland and Labrador (-4.0%) and Nova Scotia (-3.8%) reported the largest decline while Prince Edward Island (-1.5%) had the smallest.
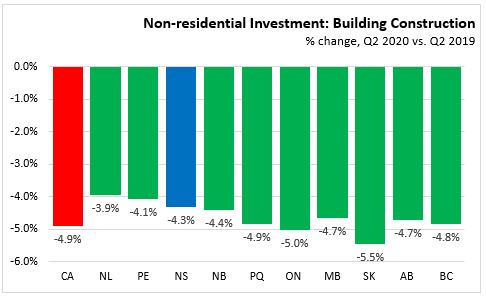
For Q2 2020 vs. Q2 2019, non-residential investment in buildings was down 4.9 per cent in Canada and all provinces reported a change within one percentage point of this decline.
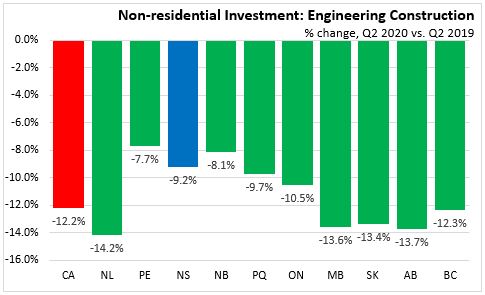
Engineering structure investment declined to a greater extent in Newfoundland and Labrador and the Prairie Provinces. The Maritime provinces reported the smallest declines in engineering construction for Q2 2020 compared to Q2 2019.
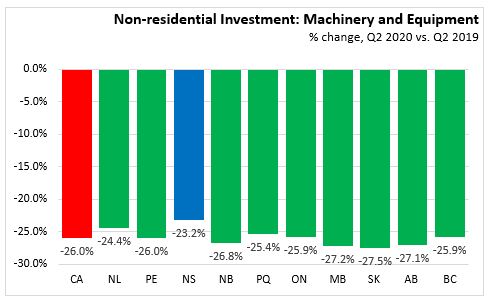
Machinery and equipment declined 26.0 per cent in Canada and all provinces reported a decline by similar amount.
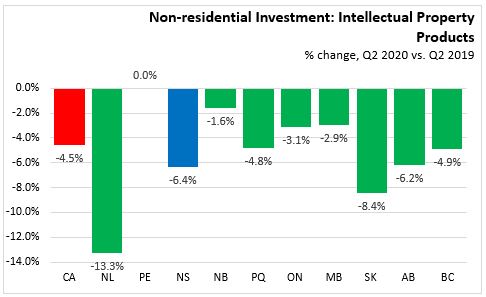
Intellectual property products decreased in all provinces, except Prince Edward Island where it was unchanged. The largest declines were in Newfoundland and Labrador (-13.3%) and Saskatchewan (-8.4%). Intellectual property product declined 6.4 per cent in Nova Scotia and 4.5 per cent in Canada for Q2 2020 compared to Q2 2019.
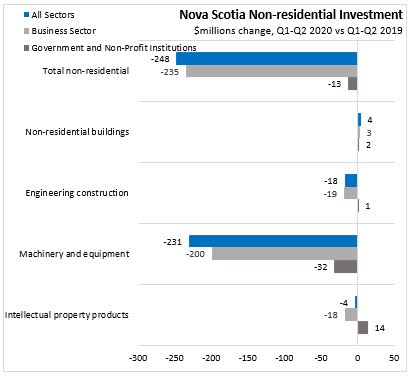
NOVA SCOTIA YEAR-TO-DATE (Q1-Q2 2020 vs. Q1-Q2 2019)
For the first half of 2020, non-residential investment in Nova Scotia has declined 8.0 per cent with a 12.4 per cent decline in the business sector and a 1.1 per cent decline for government and non-profit institutions. The largest contributor to the overall decline (-$248 million) has been in business investment in machinery and equipment (-$200 million).

Statistics Canada. Table 34-10-0163-01 Flows and stocks of fixed non-residential and residential capital, by sector and asset, provincial and territorial (x 1,000,000)