For additional information relating to this article, please contact:
May 02, 2022PROVINCIAL GDP BY INDUSTRY 2021 [PRELIMINARY] Statistics Canada released preliminary estimates of real GDP by industry for the provinces and territories in 2021.
Real GDP growth is measured at the industry level with chained 2012 dollars at basic prices (sellers' prices before taxes less subsidies on products) that removes the effect of price changes.
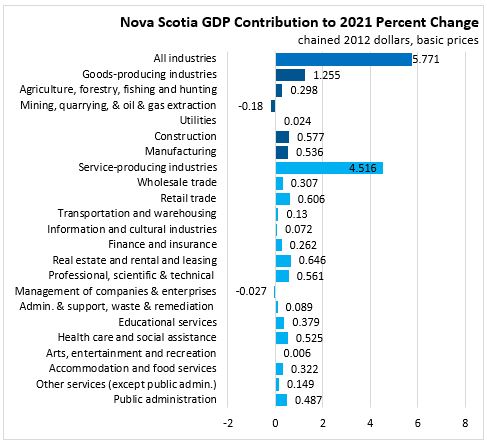
Nova Scotia's real GDP was estimated to have grown 5.8% during 2021, following a decline of 2.5% in 2020. This increase was the fastest pace in industry GDP accounts with data available back to 1985. The real GDP (chained 2012 dollars) was $39.1 billion in 2021.

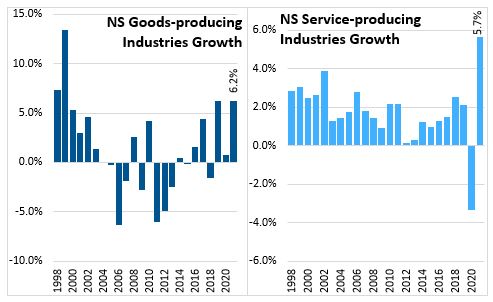
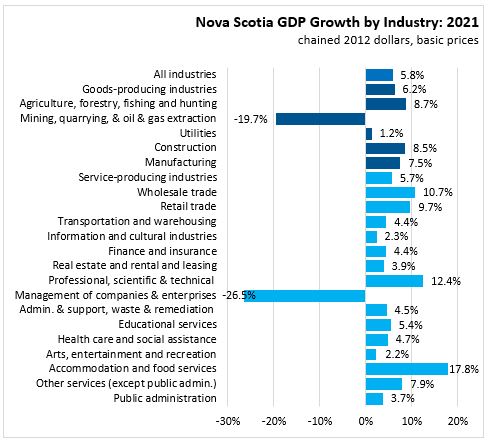
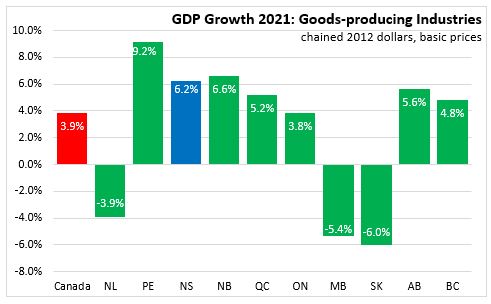
Goods-producing industries rose 6.2% in 2021, after growing 0.8% in 2020 and 6.2% in 2019. Service-producing industries grew 5.7% in 2021 after declining 3.3% in 2020 and growing 2.1% in 2019.
In goods producing industries, real GDP increased in agriculture, forestry, fishing and hunting, utilities, construction, and manufacturing while declining in mining, quarrying, and oil and gas extraction:
- Within agriculture, most subsectors increased including crop production (except cannabis) (+6.3%), licensed cannabis production (+10.1%), aquaculture (+17.9%) and animal production (+3.2%).
- Real GDP from forestry/logging (not including processing industries) increased 3.6% while support activities grew 3.3%
- Fishing real GDP increased by 10.2% in 2021 and was at its highest level since 2015.
- Mining activities was down with lower gold mining (-24.2%) and support activities for oil and gas extraction (-58.7%) offsetting higher non-metallic mineral mining (+4.9%).
- Utilities real GDP was up 1.2%, but remained 5.3% lower than 2019 levels
- Construction real GDP was up 8.5% led by residential building construction (+12.3%) and electric power engineering construction (+62.8%) with solar garden projects. Non-residential building construction (-0.7%) declined for a second consecutive year while transportation engineering construction (+3.8%) grew for a third consecutive year.
- Manufacturing real GDP increased 7.5%, after a 3.2% decline in 2020.
- Food manufacturing was up 7.4%, led by seafood (+13.2%) and increases among sugar/confectionery product, dairy, meat, miscellaneous, bakeries, wineries and other food manufacturing. Fruit and vegetable preserving and specialty food manufacturing (-11.2%) and breweries (-6.4%) declined.
- Sawmills real GDP grew 2.9% and paper manufacturing was up 1.7%
- Pharmaceutical manufacturing (+21.7%) had another year of strong growth.
- Plastic (+7.2%), rubber (+14.9%), non-metallic mineral product (+17.3%), cutlery, hand tools and other fabricated metal products (+32.9%), industrial machinery manufacturing (+21.0%), other electronic products (+34.4%), aerospace (+5.2%), ship and boat building (+11.5%), medical supplies (+10.4%) all had increases in 2021.
- Architectural and structural steel product manufacturing (-24.2%) declined.
Service producing industries grew 5.7% in 2021 with gains in all broad industry groups except the smaller management of companies and enterprises (-26.5%):
- Wholesale real GDP (+10.7%) grew in all subsectors. The largest increases in wholesale real GDP were in food and beverage, motor vehicles and parts, farm products and miscellaneous merchant wholesalers.
- Retail real GDP increased 9.7% with gains in all subsectors except unlicensed cannabis stores and non-store retailers. Compared to 2019, retail GDP is higher in all subsectors except unlicensed cannabis and clothing stores.
- Transportation and warehousing real GDP (+4.4%) growth was led by taxi and limousine services (+11.0%), truck transportation (+7.1%), support activities for transportation (+4.6%), and couriers (+7.2%). Air transportation (-9.0%) and other transit and ground passenger transportation and scenic and sightseeing transportation (-10.3%) declined. Urban transit systems and taxi and limousine services grew but remained around 40% below 2019 levels.
- Information and cultural industries (+2.3%) grew with gains in telecommunication (+1.2%), book publishers (+17.4%), motion picture and video production (+11.3%) and broadcasting (+8.6%).
- Within finance and insurance (+4.4%), real GDP increased for banks (+3.9%), credit unions (+7.6%), and insurance carriers (+5.9%), and financial investment services (+11.1%).
- Real estate (+4.2%) real GDP was positive with growth for lessors of real estate (+3.0%), owner-occupied dwellings (the imputed non-market activity of households:+3.3%), offices of real estate agents (+24.0%) while real GDP in rental and leasing services (-5.4%) declined.
- Professional, scientific and technical services real GDP (+12.4%) growth was broad-based with solid gains in all subsectors. The largest gains were in computer systems design and related services (+16.4%) and legal services (+9.1%).
- Administrative and support, waste management and remediation services real GDP (+4.5%) increased in all subsectors except employment services and travel arrangement and reservation services.
- Real GDP in educational services (+5.4%) was up in all subsectors, and only other education services (outside elementary and secondary schools, colleges, and universities) real GDP was below 2019 levels.
- Health care and social assistance (+4.7%) real GDP had increases all subsectors in 2021. The real GDP of offices of physicians, offices of dentists, and nursing and residential care facilities, all surpassed their 2020 declines. Real GDP in hospitals and social assistance (including daycares) remain below 2019 levels.
- Arts, entertainment and recreation real GDP (+2.2%) grew in 2021 with a increase in amusement and recreation (+7.6%) offsetting a decline in performing arts, spectator sports and related industries (-4.5%). Real GDP in the sector was 45.5% below 2019 level.
- Real GDP in accommodation and food services (+17.8%) increased with higher GDP in traveller accommodations (+23.1%), RV parks, camps, boarding (+15.8%) and food services (+16.9%). Real GDP in the sector was 19.2% below the 2019 level.
- Other services (except public administration) (+7.9%) was broad-based across all subsectors, but only automotive repair and maintenance recovered above 2019 levels.
- Public administration real GDP was up 3.7% with increases in defense services (+3.7%), federal public administration (+7.4%), provincial public administration (+0.9%), local, municipal and regional public administration (+2.2%) and aboriginal public administration (+7.8%).
The largest contribution to the decline in real GDP in 2020 came from real estate and rental and leasing (including owner-occupied dwellings); construction; professional, scientific and technical services; manufacturing; and health care and social assistance.
In 2021 compared to pre-pandemic 2019 level of real GDP, the Nova Scotia economy is 3.1% larger. There were 12 out of 20 sectors with higher GDP than in 2019. The largest growth over the two years was in construction (+17.0%), professional, scientific and technical service (+10.8%), and finance and insurance (+10.1%). The largest declines in real GDP from 2019 were in management of companies and enterprises (-45.5%), arts, entertainment and recreation (-45.5%), and accommodation and food services (-19.2%).

National real GDP at basic prices grew 4.8% in 2020. All provinces reported gains except Saskatchewan (-0.3%). The fastest growth was in Prince Edward Island (+6.6%), British Columbia (+6.2%) and Nova Scotia (+5.8%).
Compared to 2019, real GDP levels was higher only in Prince Edward Island (4.7%), Nova Scotia (+3.1%), British Columbia (+2.5%), and New Brunswick (+2.0%) in 2021.

Goods industry real GDP increased 3.9% in Canada with declines in three provinces: Newfoundland and Labrador, Manitoba, and Saskatchewan.
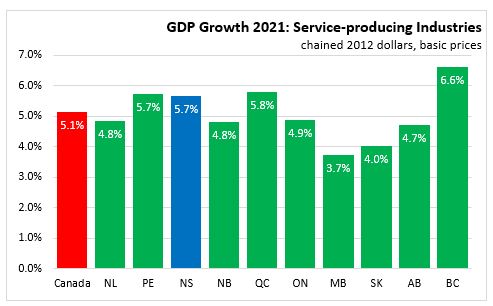
Service industry real GDP increased in all provinces and was up 5.1% in Canada and 5.7% in Nova Scotia in 2021. The largest increase was in British Columbia (+6.6%) and the smallest in Manitoba (+3.7%).
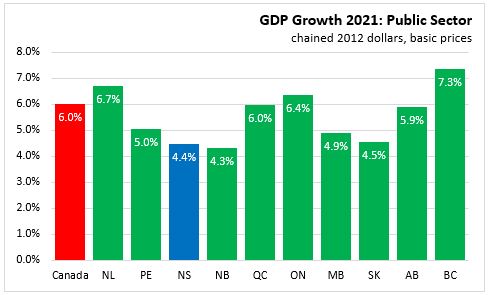
Public sector GDP (which is included in service industries) grew 6.0% in Canada and 4.4% in Nova Scotia in 2021. All provinces reported increases with the largest in British Columbia (+7.3%) and the smallest in New Brunswick (+4.3%) and Nova Scotia (+4.4%).
Source: Statistics Canada. Table 36-10-0402-01 Gross domestic product (GDP) at basic prices, by industry, provinces and territories (x 1,000,000)