For additional information relating to this article, please contact:
June 24, 2022INDUSTRIAL RESEARCH AND DEVELOPMENT, 2020 (ACTUAL), 2021 (PRELIMINARY) AND 2022 (INTENTIONS) Statistics Canada has recently released Industrial Research and Development (R&D) characteristics, including 2022 intentions, preliminary actuals for 2021 and characteristics of industrial R&D spending/personnel across provinces for 2020. Results from 2014 and beyond are not directly comparable to earlier data.
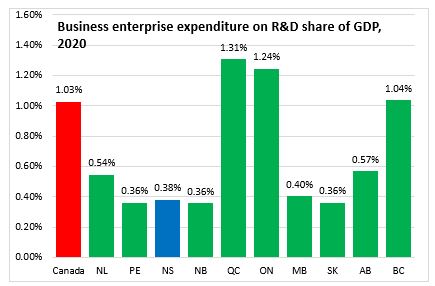
In 2020, Nova Scotia businesses spent $179 million on research and development, down 10.9% from the previous year. Nova Scotia’s total business enterprise expenditures on R&D accounted for 0.38% of its Gross Domestic Product (GDP) in 2020, down from 0.43% in the previous year.
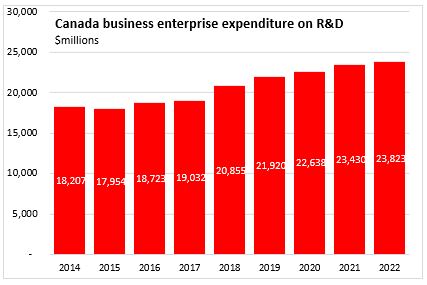
Nationally, businesses spent $22.6 billion on R&D, an increase of 3.3% over 2019 spending. Canada’s R&D spending accounted for 1.03% of its GDP in 2020, up from 0.95% in the previous year.
Quebec (1.31%), Ontario (1.24%), and British Columbia (1.04%) have the largest share of their economy in research and development expenditures in 2020.
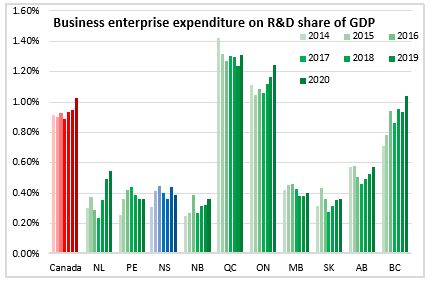
As a share of GDP, business R&D expenditures in Nova Scotia has been somewhat volatile over the last seven years. The share of industrial R&D in total GDP in Nova Scotia increased from 2014 (0.30%) to 2016 (0.44%) but were on a downward trend from 2016 to 2018 (0.35%) before increasing in 2019 (0.43%) and decline in 2020 (0.38%).
Nationally, the share of business R&D in GDP had been hovering around 0.92% from 2014-2019, before increasing as a share of GDP in 2020 to 1.03%.
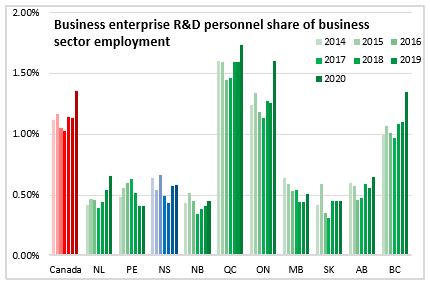
In 2020, R&D personnel accounted for 0.58% of Nova Scotia’s business sector employment, posting the second largest share across the Atlantic provinces.
Nationally, business enterprise R&D personnel was 1.35% of Canada’s total business sector employment in 2020. The largest shares were recorded in Quebec (1.74%), Ontario (1.60%) and British Columbia (1.35%).

Over the last seven years, the share business sector employment that has been business enterprise R&D personnel has generally been on a downward trend with spikes recorded in 2016, 2019 and 2020. The share of Nova Scotia’s R&D personnel peaked at 0.66% in 2016 before declining to 0.42% in 2018 and increasing to 0.58% in 2020.
In Canada, the share of R&D personnel in business sector employment was previously at its highest at 1.16% in 2015. This ratio declined to 1.02% in 2017 and was stable at 1.13% over 2018 and 2019. In 2020, the R&D personnel share increased to 1.35% as research personnel grew while business sector employment fell amid the COVID-19 pandemic.
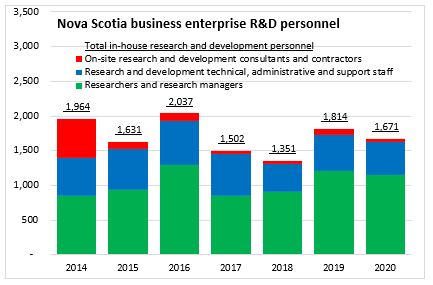
In 2020, there were 1,671 full-time equivalent (FTE) jobs for in-house research and development in Nova Scotia. This was a decrease of 7.9% from the previous year. Researchers and research managers (1,145) was the most dominant occupational category among most Nova Scotia’s business enterprise R&D personnel in 2020. The rest of the R&D personnel was divided among research and development technical, administrative and support staff (475), and consultants and contractors (51).
Preliminary estimates show that Canada’s business enterprise R&D spending grew by 3.5% from the previous year to $23,430 million in 2021. National R&D expenditures are expected to have slower growth of 1.7% to $23,823 million in 2022.
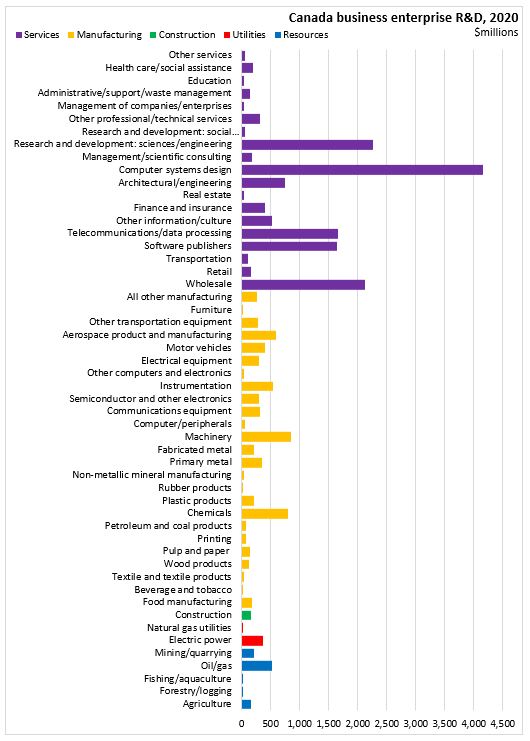
Looking at the R&D spending by industry, majority of the R&D spending in Canada was undertaken by businesses in service sectors. The computer systems designs and related services sector had the largest R&D spending ($4,164 million) in 2020. This was followed by research and development: sciences/engineering ($2,255 million) and wholesale sector ($2,133 million).
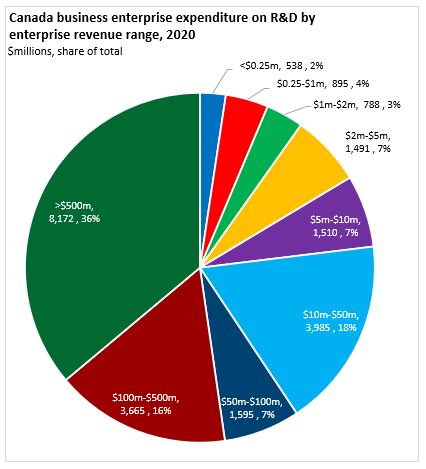
In 2020, Canadian businesses with revenues higher than $500 million had the largest share of total R&D spending accounting for 36% of total R&D expenditures. This was followed by businesses with revenues between $10 million and $50 million (18%) and revenues between $100 million and $500 million (16%) in 2020.
Source: Statistics Canada,Table 27-10-0333-01 Business enterprise in-house research and development expenditures, by industry group based on the North American Industry Classification System (NAICS), country of control and expenditure types (x 1,000,000); Table 27-10-0334-01 Business enterprise in-house research and development expenditures, by country of control and revenue group (x 1,000,000); Table 27-10-0341-01 Business enterprise in-house research and development characteristics, by industry group based on the North American Industry Classification System (NAICS), country of control and provinces and territories; Table 36-10-0222-01 Gross domestic product, expenditure-based, provincial and territorial, annual (x 1,000,000); Table 36-10-0480-01 Labour productivity and related measures by business sector industry and by non-commercial activity consistent with the industry accounts