For additional information relating to this article, please contact:
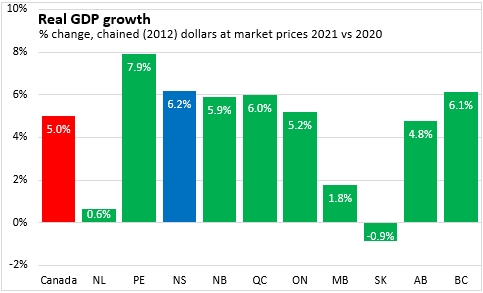
November 08, 2022PROVINCIAL GDP BY INCOME AND EXPENDITURE ACCOUNTS 2021 Nova Scotia's real GDP grew by 6.2% in 2021 - the second fastest growth among provinces after Prince Edward Island. Canada's real GDP increased by 5.0% with strong gains reported across most provinces (except Newfoundland and Labrador and Saskatchewan) as economies emerged from pandemic-related restrictions.
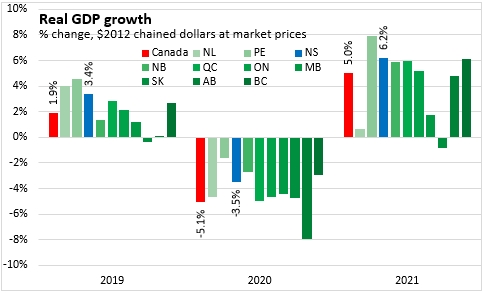
Data for 2020 and 2019 were also revised.
The impacts of the pandemic on Nova Scotia's economy in 2020 were more severe than previously estimated. Nova Scotia's real GDP is now estimated to have contracted by 3.5% in 2020. This was better than the national average decline of 5.1%, but worse than reported in Prince Edward Island, New Brunswick and British Columbia.
Prior to the pandemic, Nova Scotia's real GDP grew by 3.4% in 2019 - an upward revision from the previous estimate.
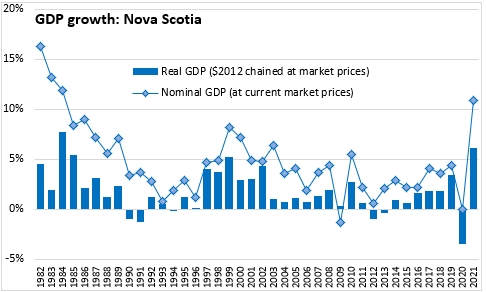
Nova Scotia's economic rebound in 2021 was the strongest growth since 1984.
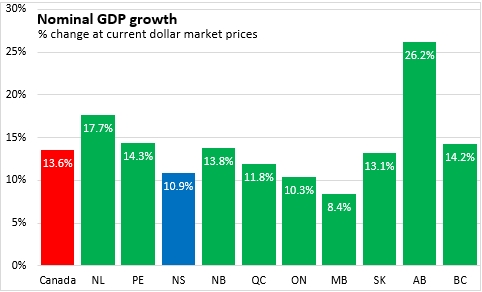
Nova Scotia's nominal GDP growth was 10.9% in 2021, including the increase in value associated with both price and volume changes. National nominal GDP growth was 13.6% with strong gains in all provinces. Alberta and Newfoundland and Labrador reported the largest increases in nominal GDP (partially attributable to recovery in prices for oil produced in these jurisdictions). The slowest gains in nominal GDP were reported in Manitoba and Ontario.
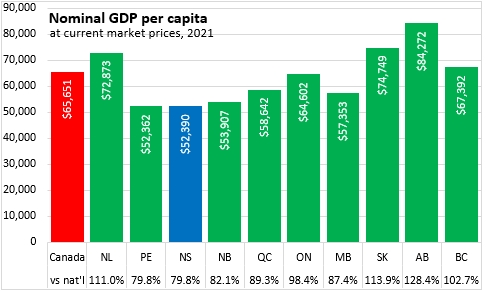
Nova Scotia's per capita nominal GDP amounted to $52,390 per person, or 79.8% of the national average. Nova Scotia's nominal GDP per capita was the second lowest among provinces - just ahead of Prince Edward Island. Canada's major resource-producing provinces (Alberta, Saskatchewan, Newfoundland and Labrador) reported the largest nominal values of GDP per capita.
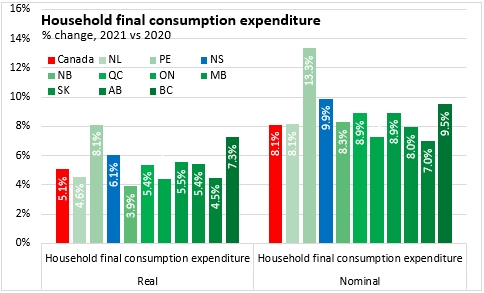
Nova Scotia's household consumer expenditures grew by 6.1% in real terms (third fastest among provinces) and 9.9% in nominal terms (second fastest among provinces). All provinces reported strong gains in real and nominal consumer spending as these activities had been significantly curtailed by pandemic related restrictions in 2020.
Statistics Canada noted that substantial gains in household spending for Prince Edward Island and Nova Scotia reflected rapid population increases.
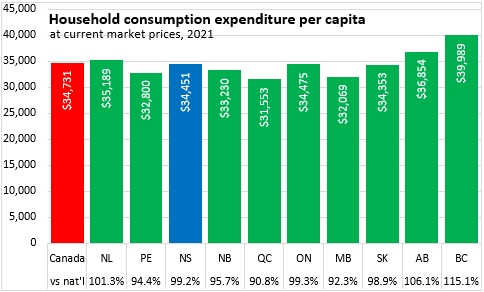
Despite nominal GDP per capita of 79.8% of the national average, Nova Scotia's nominal household consumer expenditures were $34,451 in 2021 or 99.2% of the national average.
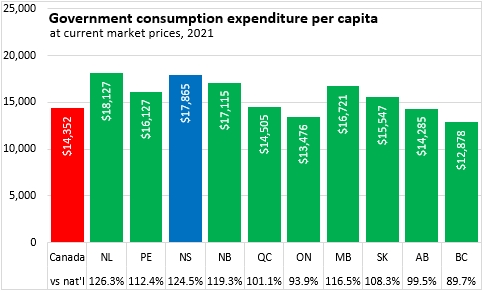
Final consumption expenditures from all levels of government were up 4.8% in real terms for Nova Scotia and 8.0% in nominal terms. Government expenditure growth was strong coming out of the pandemic with gains in all provinces (albeit slower growth in Alberta).

Nova Scotia reported the second highest level of nominal government expenditures per capita among provinces (after Newfoundland and Labrador) at $17,865. As these expenditures include all levels of government, Nova Scotia's large military presence increases government expenditures per capita to 124.5% of the national average. Government consumption expenditures per capita were lowest in British Columbia and Ontario.
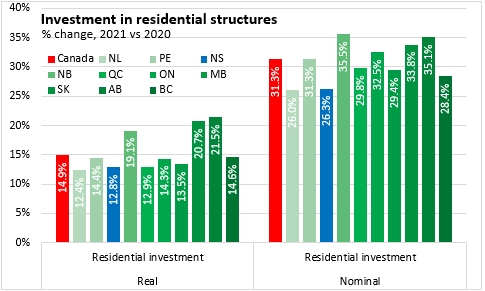
Nova Scotia's investment in residential structures (including both new and renovation spending) was up 12.8% in real terms and 26.3% in nominal terms. Despite these growth rates being the highest in decades for Nova Scotia's residential construction investments, they were the second slowest growth among provinces, ahead of only Newfoundland and Labrador.
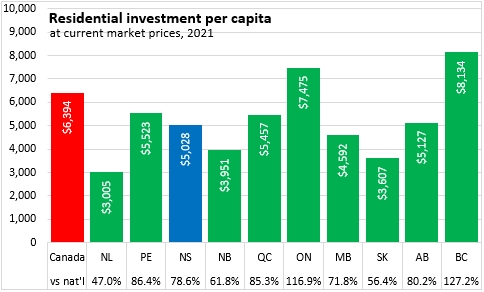
Nova Scotia's residential investments amounted to $5,028 per capita in 2021 or 78.6% of the national average. Residential investments per capita shown here are in nominal terms and elevated home prices in Ontario and British Columbia contribute to higher investments per capita in these provinces. Newfoundland and Labrador reported the lowest per capita investments in residential structures.
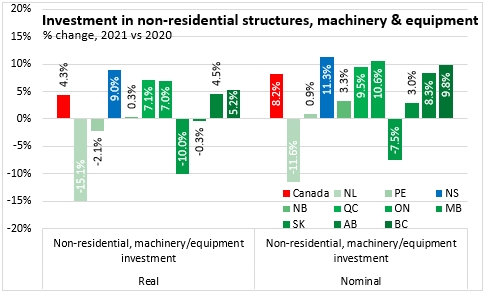
Nova Scotia's growth in business investment for non-residential structures as well as machinery and equipment led the country at 9.0% in real terms and 11.3% in nominal terms. National growth in investment for non-residential structures, machinery and equipment was 4.3% in real terms and 8.2% in nominal terms. Newfoundland and Labrador and Manitoba reported the largest declines.
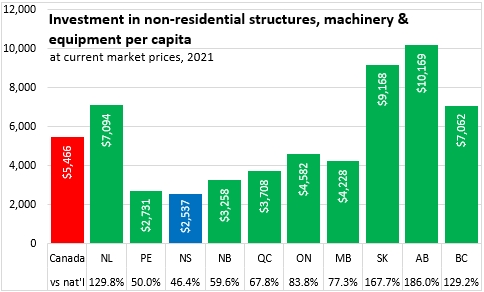
Despite strong growth, Nova Scotia's overall level of per capita business investment in non-residential structures, machinery and equipment was the lowest among provinces at $2,537. Canada's major resource-producing provinces all reported substantially higher per capita business investments in non-residential structures, machinery and equipment.
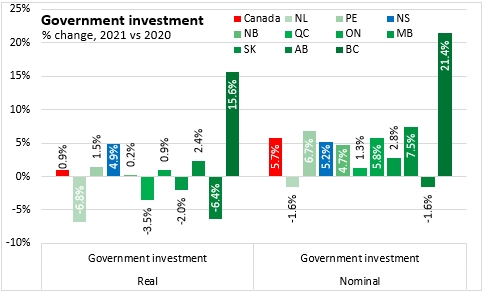
Government (as opposed to business) investment in Nova Scotia increased by 4.9% in real terms and 5.2% in nominal terms. The small gap between real and nominal growth suggests little impact from price growth for government investments in 2021. Government investment growth was notably faster in British Columbia in 2021. Alberta and Newfoundland and Labrador reported the largest declines in government investment in 2021.
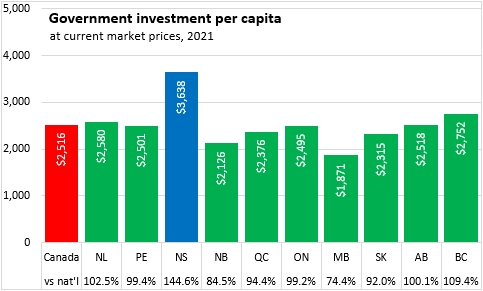
On a per capita basis, Nova Scotia reported the highest level of nominal government investments in 2021 at $3,638 or 144.5% of the national average. Manitoba reported the lowest level of government investment per capita in 2021.
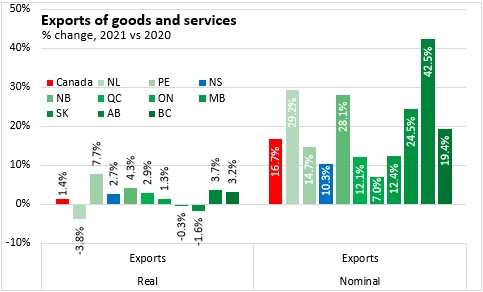
Nova Scotia's exports of goods and services - which includes both international and interprovincial destinations - increased by 2.7% in real terms and 10.3% in nominal terms. Although Nova Scotia's real exports grew faster than the national average in 2021, limited price growth left Nova Scotia with the second slowest growth among provinces for nominal exports, ahead of Ontario. Provinces whose export values are sensitive to oil prices (Alberta, Saskatchewan, Newfoundland and Labrador and New Brunswick) reported the strongest increases in nominal exports. Saskatchewan's real exports were slowed by the effects of drought conditions on crop production.
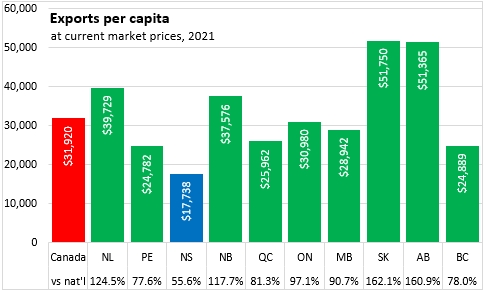
Nova Scotia's per capita exports were the lowest among provinces - by a substantial margin. The $17,738 in per capita interprovincial and international exports from Nova Scotia amounted to 55.6% of the national average. The next lowest province (Prince Edward Island) had exports of $24,782 per capita or 77.6% of the national average. All three major resource-producing provinces reported the strongest exports per capita, along with New Brunswick.
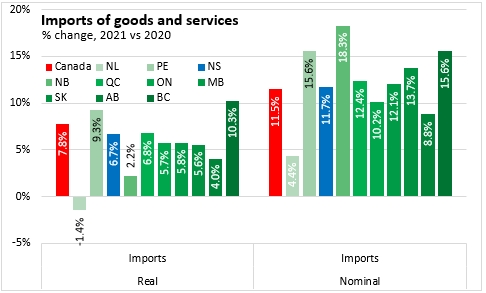
As the economy recovered in 2021, Nova Scotia's imports grew by 6.7% in real terms and 11.7% in nominal terms. Imports - both international and interprovincial sources - were up for all provinces (except in real terms for Newfoundland and Labrador). New Brunswick - which imports a substantial volume of crude oil for refining - reported the largest increase in nominal imports.
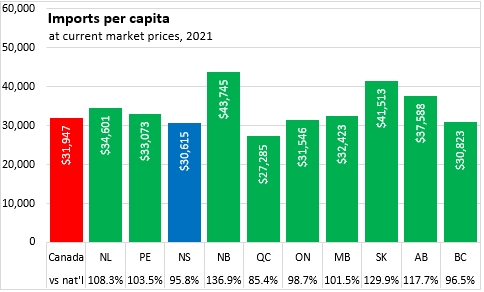
Nova Scotia's per capita imports amounted to $30,615 or 95.8% of the national average. Quebec reported the smallest imports per capita while New Brunswick reported the largest imports per capita.
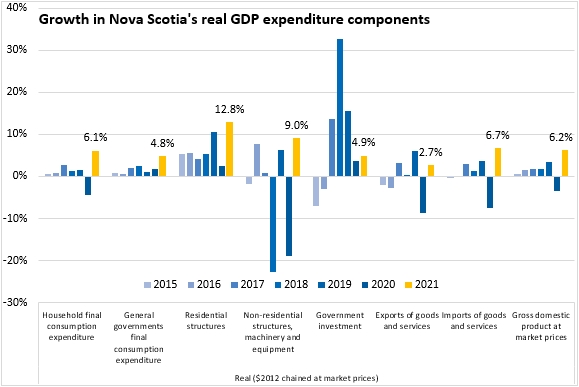
Nova Scotia's overall economic growth in 2021 depended on strong business investments - both in residential structures and non-residential structures, machinery and equipment. Household consumer spending, government consumption, government investment and exports all contributed to growth as well, though these were partially offset by rising imports.

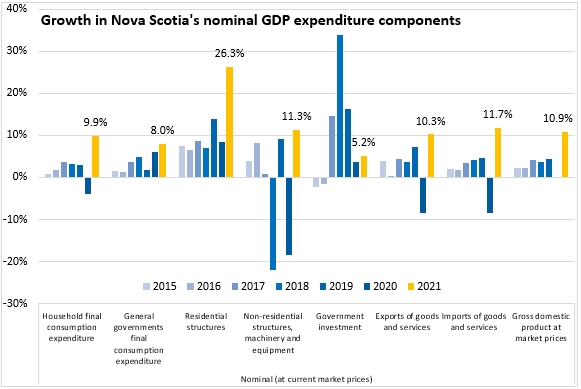
In nominal terms, the increase in Nova Scotia's residential investment stands out in its contribution to nominal GDP growth. The sizable gap between real and nominal investment reflects substantial price gains on top of higher real investment volumes.
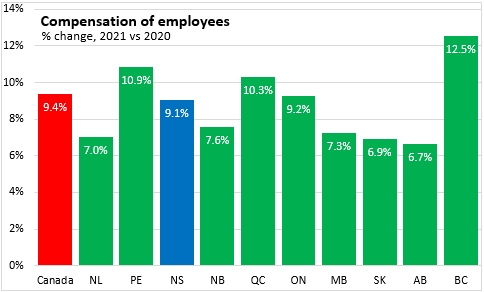
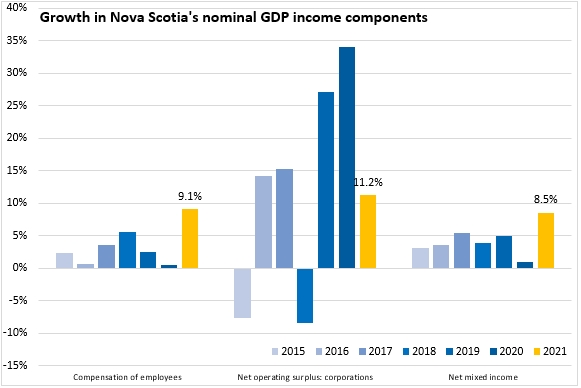
Compensation of employees for all industries was up 9.1% in Nova Scotia in 2021. This was just below the national pace of 9.4%. Employee compensation grew fastest in British Columbia, followed by Prince Edward Island. Employee compensation growth was slowest in Alberta, followed by Saskatchewan and Newfoundland and Labrador.
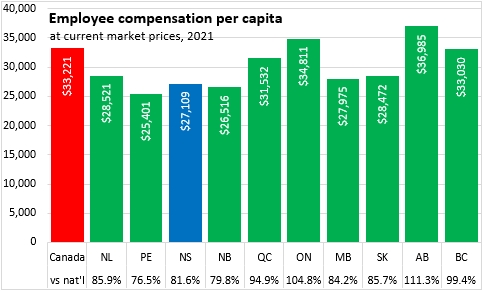
Nova Scotia's employee compensation per capita was $27,109 in 2021 or 81.6% of the national average. Only the other two Maritime provinces had less employee compensation per capita. Employee compensation per capita was highest in Alberta, followed by Ontario.
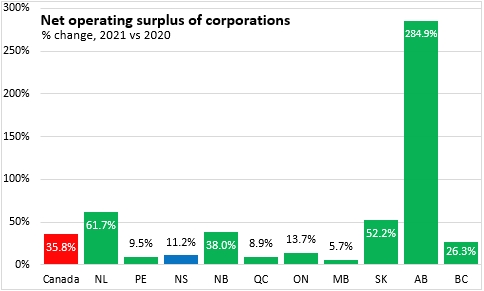
Growth in net operating surplus of corporations is typically volatile from one year to the next. Alberta's net operating surplus of corporations was up almost four-fold from 2020 to 2021. There were also sharp increases in Newfoundland and Labrador, Saskatchewan and New Brunswick. Most non-resource producing provinces had more modest gains in corporate net operating surplus, including 11.2% in Nova Scotia.
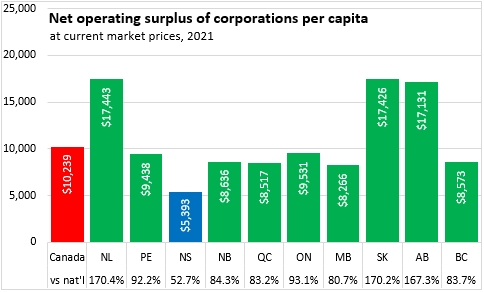
Nova Scotia reported by far the lowest corporate net operating surplus per capita at $5,393 in 2021 - just 52.7% of the national per capita average. Manitoba reported the second lowest per capita corporate net operating surplus at $8,266 or 80.7% of the national average. The three major resource-producing provinces (Alberta, Saskatchewan and Newfoundland and Labrador) all reported substantially higher corporate net operating surplus per capita.
Nova Scotia reported an 8.5% increase in net mixed income of unincorporated businesses in 2021 - third fastest among provinces after the other two Maritime provinces. Only Saskatchewan reported a decline in net mixed income.
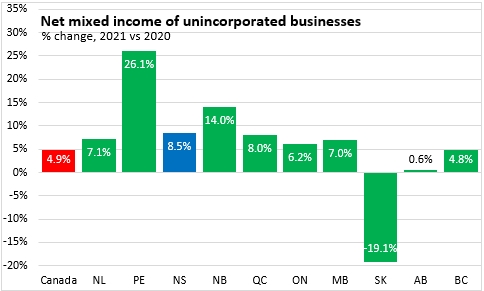
Unlike corporate net operating surplus, Nova Scotia's net mixed income per capita exceeds the national average at $5,792 (101.9% of national). British Columbia reported much higher per capita net mixed income of unincorporated businesses. Quebec reported the lowest per capita net mixed income.

Growth in employee compensation, net operating surplus of corporations and net mixed income all contributed to Nova Scotia's overall nominal GDP growth in 2021.
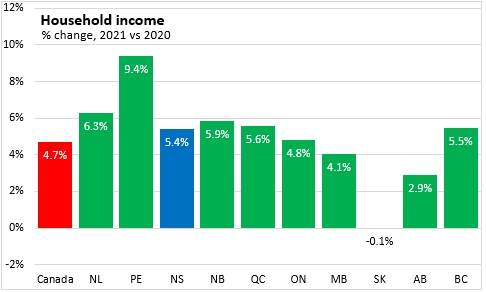
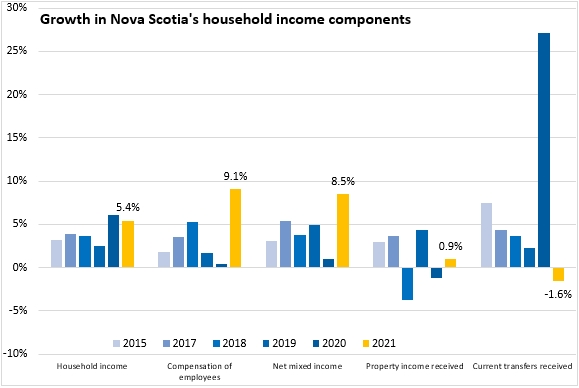
Household income grew by 5.4% in Nova Scotia in 2021 - exceeding the national growth of 4.7%. All provinces except Saskatchewan reported growth in household income in 2021. Prince Edward Island reported the fastest rise in household income.
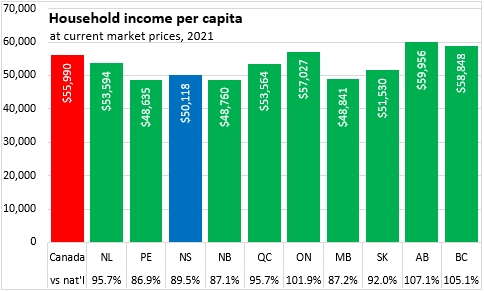
Nova Scotia's per capita household income was $50,118 in 2021 or 89.5% of the national average. Alberta reported the highest per capita household income. The gap between lowest (Prince Edward Island, 86.9% of national) and highest (Alberta, 107.1% of national) per capita household income is substantially narrower than reported for per capita nominal GDP.
Household income includes employee compensation, net mixed income, property income received and current transfers received. It is reported on a national rather than a domestic basis.
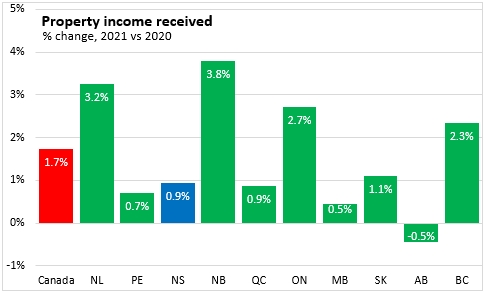
Property income received by households (such as interest, dividends, pensions) increased by 0.9% in Nova Scotia in 2021, slower than the national average of 1.7%. Only Alberta reported lower property income receipts in 2021 while New Brunswick reported the largest increase.
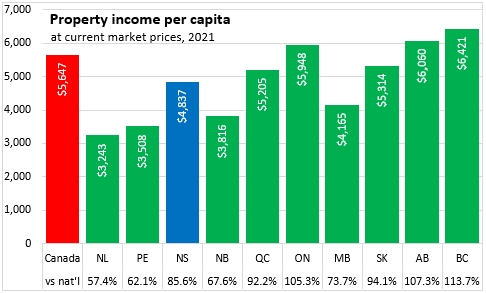
Nova Scotia's property income receipts were $4,837 per capita or 85.6% of the national average. Receipts were highest in British Columbia, Alberta and Ontario and lowest in the three Atlantic provinces outside Nova Scotia.
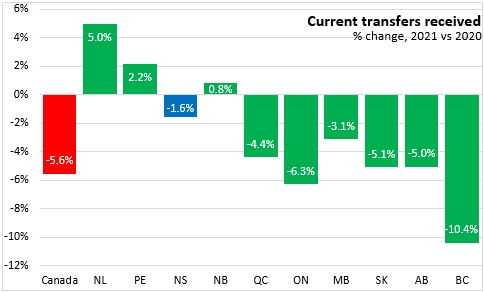
Current transfers received declined by 1.6% in Nova Scotia, including the effects of withdrawing pandemic-related transfers that supported incomes in 2020. Nationally, current transfers were down 5.6% with larger declines in central and western provinces than were reported in Atlantic Canada (current transfers increased in the other three Atlantic provinces).
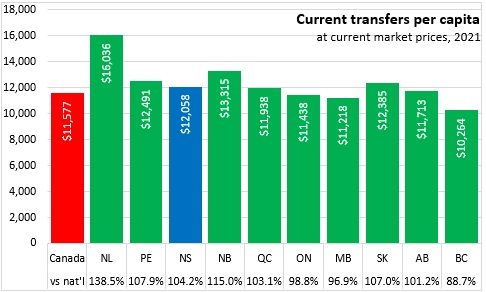
Current transfers per capita were highest in Newfoundland and Labrador and lowest in British Columbia. Nova Scotia's current transfers per capita were $12,058 or 104.2% of the national average.
Nova Scotia's growth in household income in 2021 came substantially from rising employee compensation as well as net mixed income while property income growth was minimal and current transfers declined.
The GDP deflator is the implicit price index that establishes the difference between nominal GDP growth (which includes both price and volume gains) and real GDP growth (which includes only volume changes). This implicit price index is a broader measure of price growth than the consumer price index, which only considers a fixed basket of household consumption items.
In 2021, Nova Scotia reported the slowest growth among provinces in the GDP deflator at 4.5%. The three resource-producing provinces - whose oil and gas export prices rebounded with global oil prices in 2021 - reported much larger increases in their respective price indices for GDP.
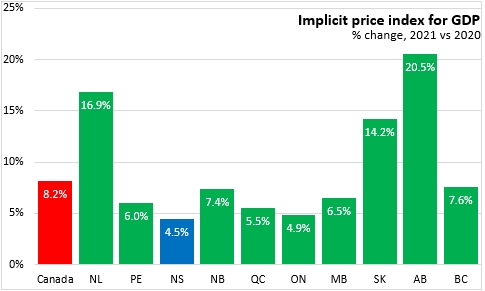
Nova Scotia's 4.5% increase in the implicit price index for GDP was the fastest since 2003. The national GDP deflator gain of 8.2% was the fastest since 1982.

Notes: Income and expenditure accounts provide the official estimates of Nova Scotia's gross domestic product (GDP) and select indicators. The estimates released today include revisions for the years 2019 and 2020 and the first estimate of expenditure and income for 2021. GDP as measured by the expenditure account refers to all final consumption and investment spending not bound for further production in the Nova Scotia economy in the year. Exports are added to this whether these are final or intermediate goods they are not bound for further production in Nova Scotia in the year. Imports are subtracted from this value (regardless of whether they are final or intermediate products) as any final expenditure that includes direct or embedded imports would not generate income for Nova Scotia factors of production in the year.
In the income accounts, GDP represents the generation of income from production activities. This income is spread across compensation of employees (in all industries), operating surplus of corporations (including both net operating surplus and consumption of fixed capital), mixed income of unincorporated businesses (including net mixed income as well as consumption of fixed capital by unincorporated businesses) along with adjustments to taxes on products and taxes on production. The analysis below focuses on employee compensation, net operating surplus of corporations and net mixed income of unincorporated businesses - all measured in nominal terms.
Household income includes components from the income account of GDP: employee compensation net mixed income (but measured on a 'national' as opposed to 'domestic' basis). The rest of household income is made up of earnings that are not derived from current production: property income received from ownership of real or financial assets as well as current transfers received from governments and corporations.
Source: Statistics Canada. Table 36-10-0221-01 Gross domestic product, income-based, provincial and territorial, annual (x 1,000,000); Table 36-10-0222-01 Gross domestic product, expenditure-based, provincial and territorial, annual (x 1,000,000); Table 36-10-0482-01 Property income of households, provincial and territorial (x 1,000,000); Table 36-10-0226-01 Household sector, selected indicators, provincial and territorial; Table 36-10-0223-01 Implicit price indexes, gross domestic product, provincial and territorial