For additional information relating to this article, please contact:
February 12, 2024SOCIOECONOMIC PROFILE OF 2SLGBTQ+ CANADIANS, 2019/2021 Statistics Canada has released new information on the socioeconomic profile of 2SLGBTQ+ Canadians. These data are drawn from the 2019 and 2021 iterations of the Canadian Community Health Survey.
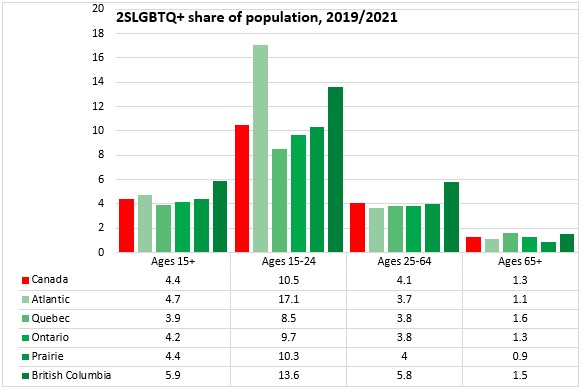
In Canada, 4.4% of the adult population (aged 15+) identifies as 2-spirited, lesbian, gay, bisexual, trans, queer or plus (2SLGBTQ+; data are not yet collected on populations that identify as intersex).
These proportions are higher in Atlantic Canada (4.7%) and British Columbia (5.9%). Québec has the lowest share of the population that reports identifying as 2SLGBTQ+ (3.9%).
The proportion of the population aged 15-24 that identify as 2SLGBTQ+ is notably larger, particularly in Atlantic Canada and British Columbia. The portion of older Canadians (aged 65+) identifying as 2SLGBTQ+ was notably smaller.
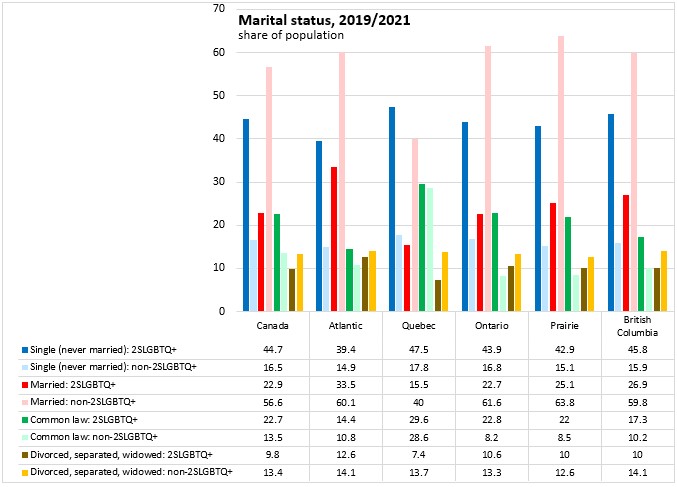
Across Canada, a higher portion of the 2SLGBTQ+ population were single (never married) or in common-law relationships while a higher portion of the non-2SLGBTQ+ population were married. Marriage was more common than the national averages for both population groups in Atlantic Canada.
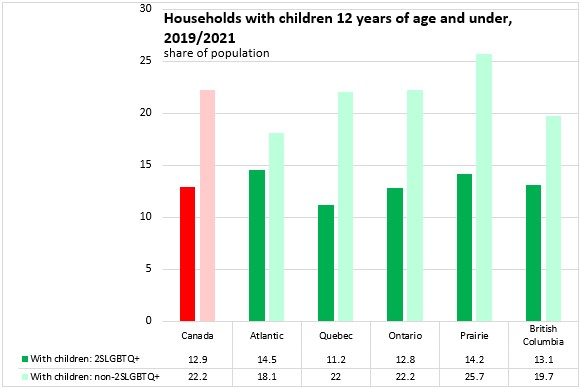
Across Canada 12.9% of the 2SLGBTQ+ population lived in households with a child aged 12 or under (22.2% for the non-2SLGBTQ+ population). A higher portion of 2SLGBTQ+ households in Atlantic Canada reported living with a child 12 years or age or younger.
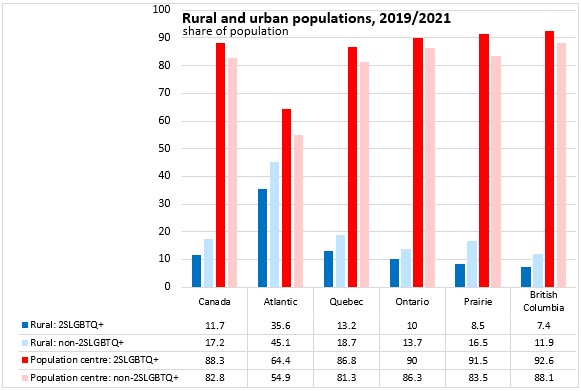
Across Canada, 11.7% of the 2SLGBTQ+ population lived in a rural area while 88.3% lived in a population centre. In every region, the 2SLGBTQ+ population was more concentrated in population centres than in rural areas. In Atlantic Canada, rural population shares were higher for both 2SLGBTQ+ and non-2SLGBTQ+ populations.
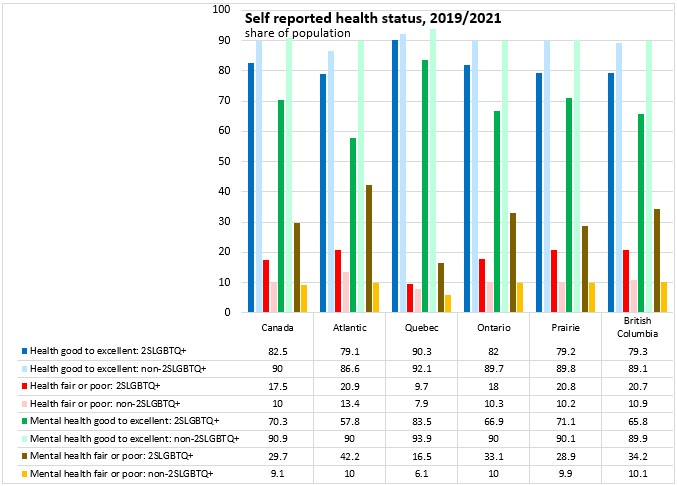
When asked about perceived health status, members of the 2SLGBTQ+ population were less likely to report good, very good or excellent general health and more likely to report fair or poor general health than the non-2SLGBTQ+ population. This gap was narrowest in Québec.
The gaps in perceived health were more acute when focusing on perceived mental health, where 2SLGBTQ+ populations were less likely to report good to excellent mental health and substantially more likely to report fair or poor mental health (particularly in Atlantic Canada).
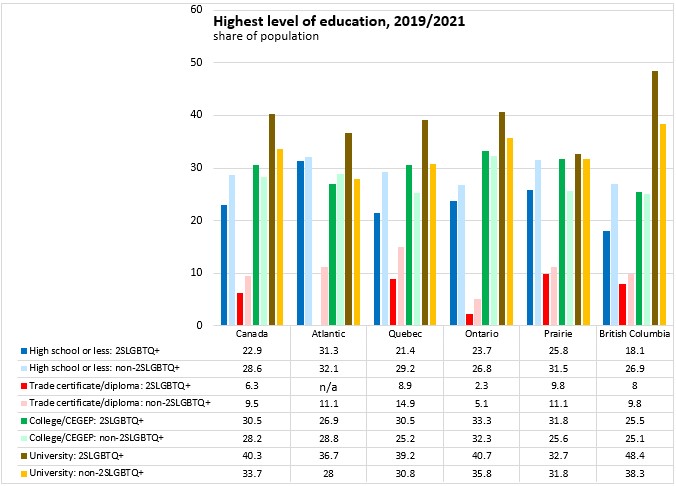
Across Canada, 2SLGBTQ+ populations were more likely to have a university (bachelor or higher) degree or a college/CEGEP education than the non-2SLGBTQ+ population. One exception is in Atlantic Canada where the non-2SLGBTQ+ population had a higher portion with college education than the 2SLGBTQ+ population.
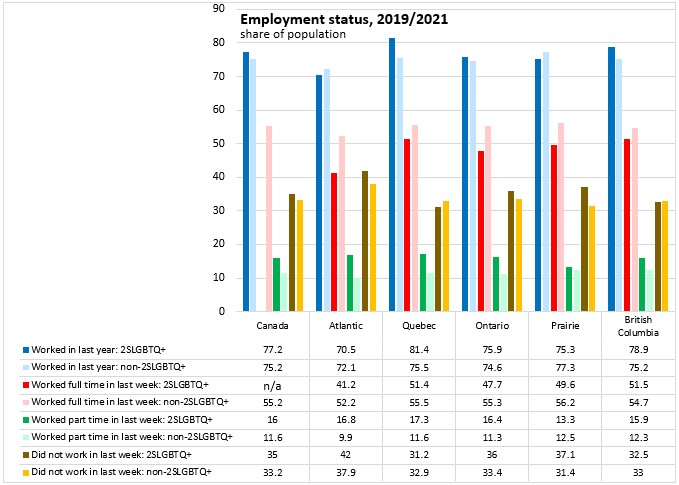
Across Canada, those among the 2SLGBTQ+ population were more likely to have worked in the past year than the non-2SLGBTQ+ population. However, this was not the case in Atlantic Canada or the prairie provinces.
When asked about recent work (in the last week), 2SLGBTQ+ respondents in every region were less likely to report full time work than the non-2SLGBTQ+ population.
Part time work in the last week was more prevalent among 2SLGBTQ+ populations than among the non-2SLGBTQ+ populations in every region.
Not working at all in the last week was more commonly reported among 2SLGBTQ+ populations (compared to non-2SLGBTQ+ residents) in Atlantic Canada, Ontario and the prairie provinces, but not in Québec or British Columbia.
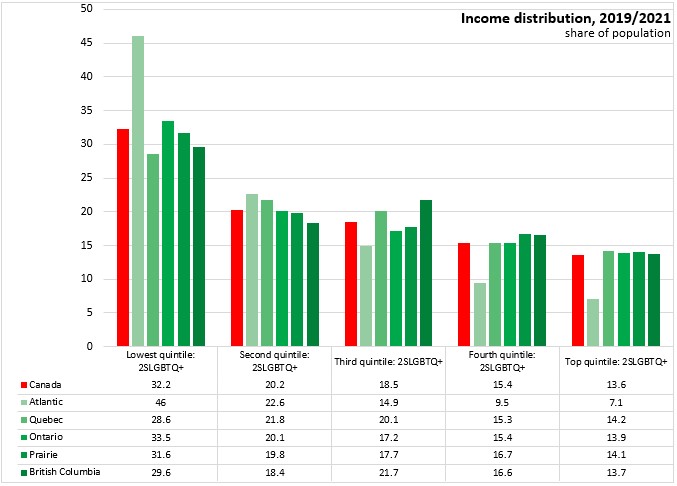
Across the entire country, an income quintile should represent 20% of the population. However, for the 2SLGBTQ+ population, a notably higher share of the population (32.2% nationally) were in the lowest income quintile. This was particularly the case in Atlantic Canada, which may reflect the higher proportion of 2SLGBTQ+ respondents among those aged 15-24 (who typically report lower incomes).
Across Canada, there were notably lower portions of the 2SLGBTQ+ population in the two highest income quintiles.
Source: Statistics Canada. Table 13-10-0874-01 Socioeconomic characteristics of the 2SLGBTQ+ population, 2019 to 2021