For additional information relating to this article, please contact:
February 28, 2025HALIFAX BUSINESS CONDITIONS: FEBRUARY 17-FEBRUARY 23, 2025 Statistics Canada has released real-time local business conditions from February 17 - February 23, 2025. Reference dates reported now refer to the date following the end of the reference week. These data are not adjusted for seasonality and monthly or weekly changes may simply reflect regular seasonal patterns.
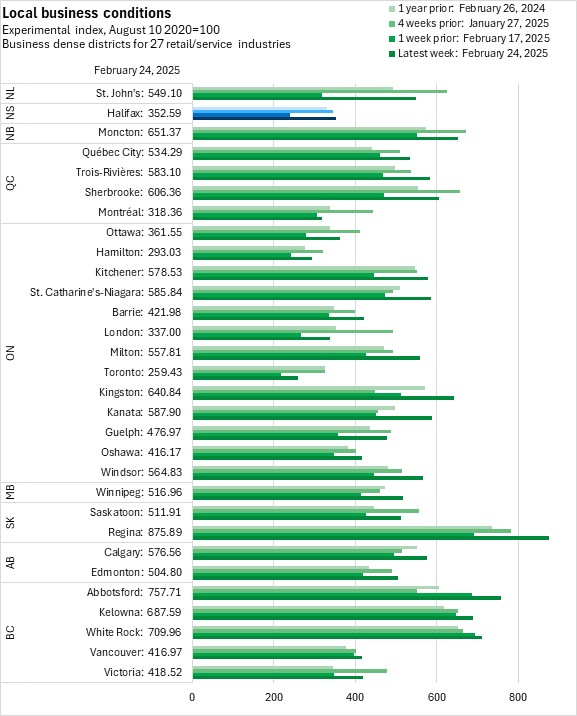
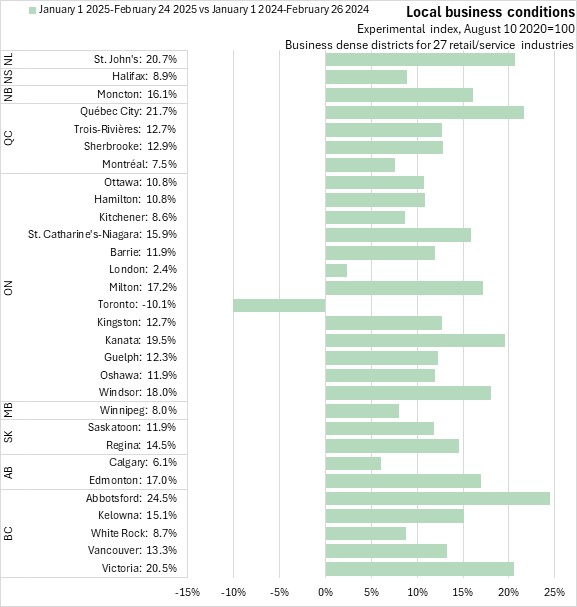
From August 10 of 2020 to February 24, 2025, the local business conditions index for Halifax increased by 252.59%. Regina, Abbotsford, and White Rock reported the strongest growth in business conditions over this period while Toronto and Hamilton had the smallest gains.
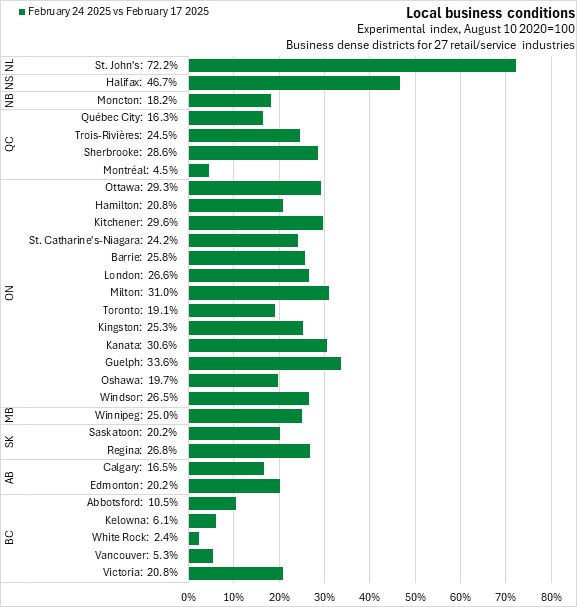
Halifax business conditions improved by 46.7% in the week ending February 24. Of 30 urban centers, all reported stronger business conditions compared to the week prior. These data are not seasonally adjusted, and such fluctuations commonly occur during winter months. St. John’s and Halifax reported the strongest improvement in business conditions in the last week. White Rock, Montréal, and Vancouver reported the slowest improvement in business conditions.
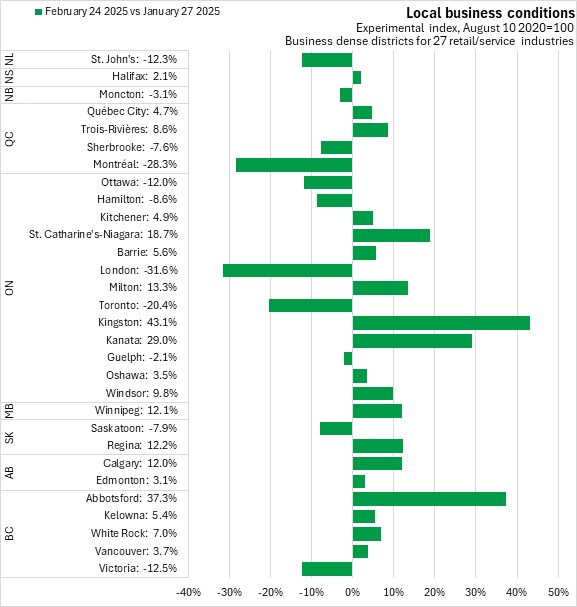
Compared with four weeks prior, business conditions were up 2.1% in Halifax. 19 cities reported stronger business conditions compared with four weeks prior. Kingston, Abbotsford, and Kanata reported the fastest gains while Toronto, Montréal, and London reported the steepest declines.
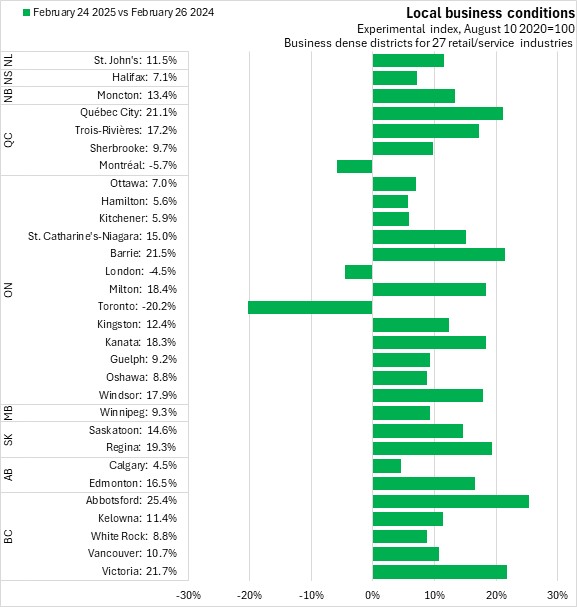
Compared with the same week a year ago, Halifax business conditions have improved 7.1%. Abbotsford, Victoria, and Barrie reported the largest gains over this period, while Toronto reported the largest decline.
In the first eight weeks of 2025, Halifax reported a 8.9% improvement in business conditions compared to the same period in 2024. All cities except Toronto reported gains compared to the first eight weeks of 2024. The largest gain was reported in Abbotsford.
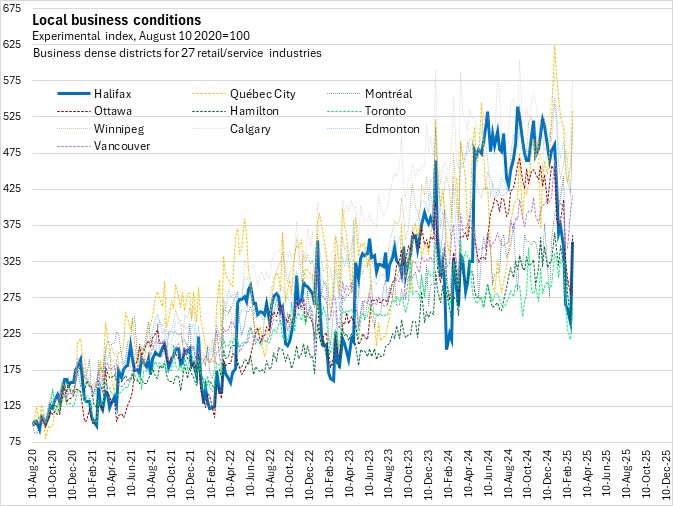
Halifax business conditions typically fall sharply during the winter months and rebound in the spring. Prior to the strong rebound in the latest week of data, this pattern appeared to be repeating this winter, with a sharp decline in the first weeks of the year. This puts Halifax behind most large urban centres (population >800,000), currently only ahead of Toronto, Hamilton, and Montréal.
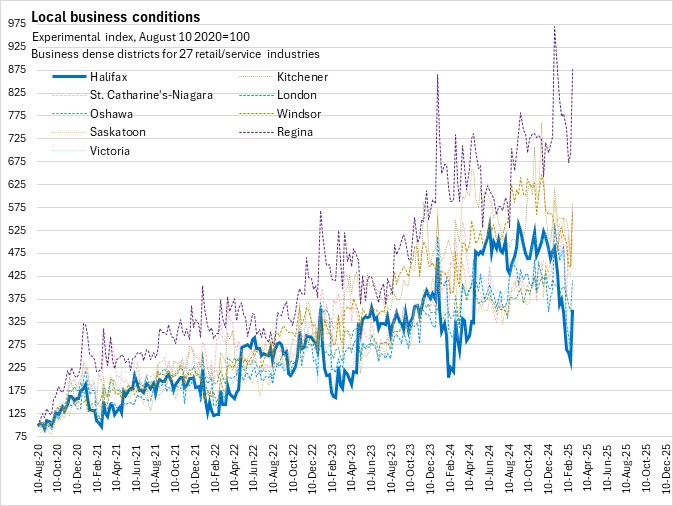
Despite the recent rebound, Halifax continued to report the weakest business conditions among medium urban centres (250,000<population<800,000) except London.
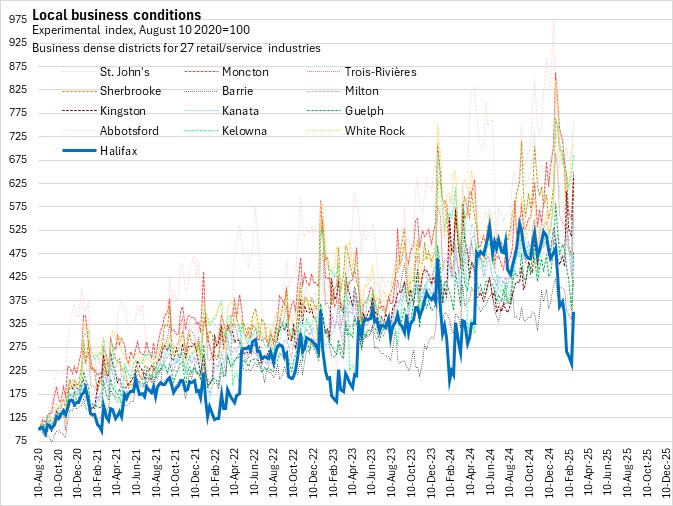
Halifax business conditions also remain behind levels observed in all other smaller urban centres (population<250,000).
Notes
This experimental data product starts from information on the number of businesses listed in the business register in "business dense areas" of a large urban centre. Data from 20116 business locations provided baseline (ie: pre-pandemic) insight on business revenue and employment.
The data focus on 10 industries in particular: retail bakeries, furniture stores, electronics/appliance stores, building materials/garden supply stores, food/beverage stores, gas stations/convenience stores, clothing stores, cycling stores, book stores, general merchandise stores, florists, cinemas, dental offices, museums, zoos/gardens, amusement/theme parks, casinos, fitness/recreation centres, bowling alleys, drinking places, restaurants, and personal care services (such as hair care or esthetics).
Data on current operating conditions (open vs. closed) were collected from commercial application-program interfaces (API). Most of the information is drawn from Google's Places API, which is similar to what is available publicly on Google Maps, with supplementary information from APIs offered by Yelp Fusion and Zomato. Queries to the API are based on a sampling approach ('density-based cursory search') that focuses on the densest areas for business locations in the selected industries. Statistics Canada cautions that the sampling methods used do not follow standard statistical methods due to cost and technical limitations.
Data on current traffic volumes were drawn from TomTom's historical traffic information. As with operating conditions, the information was drawn from a sample of routes within identified business-dense areas. Statistics Canada cautions that traffic volume estimates and their relationship to business conditions may be sensitive to changing traffic patterns, construction/detours, and changes to business models such as curbside pickup or delivery.
The index of real-time local business conditions is estimated as the value of retail revenue, adjusted for both percentage of reported business closures as well as changes in traffic volumes from pre-pandemic levels.
The value of the index was set to 100 as of August 2020. As such, the index shows changes since then, but does not represent the variations in business conditions that existed in the initial period. A location with strong local business conditions in August 2020 would have less opportunity to grow than a location with weak conditions in the same month.
Source: Statistics Canada. Table 1010-10-010168-01 Real-time Local Business Condition Index (RTLBCI)
Statistics Canada catalogue 71-607X. Real-Time Local Business Conditions Index: Concepts, data, methodology,
https://publications.gc.ca/collections/collection_2021/statcan/71-607-x/71-607-x2021017-eng.pdf, July 15, 2021