For additional information relating to this article, please contact:
January 08, 2026AVERAGE RETAIL PRICES, NOVEMBER 2025 Year-over-year (November 2025 vs November 2024)
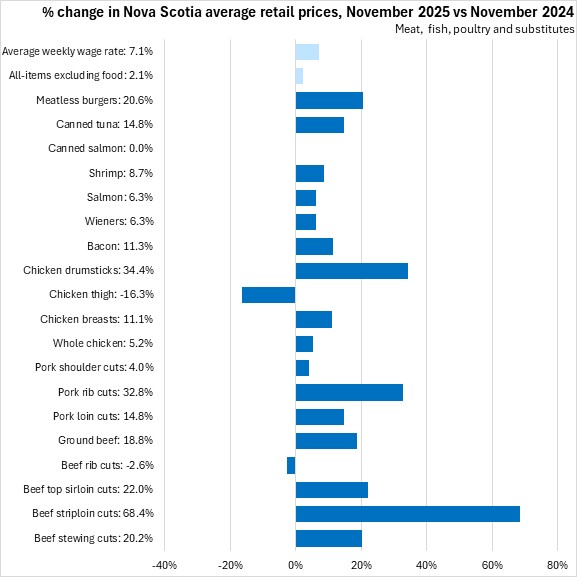
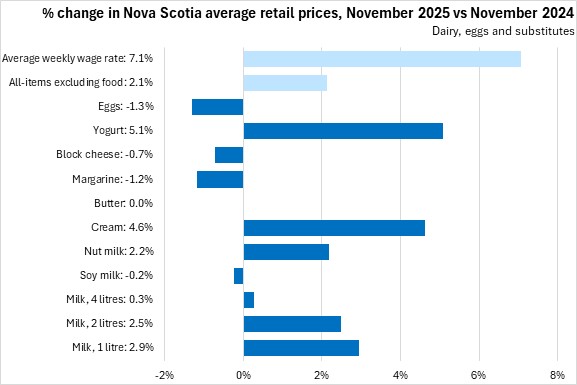
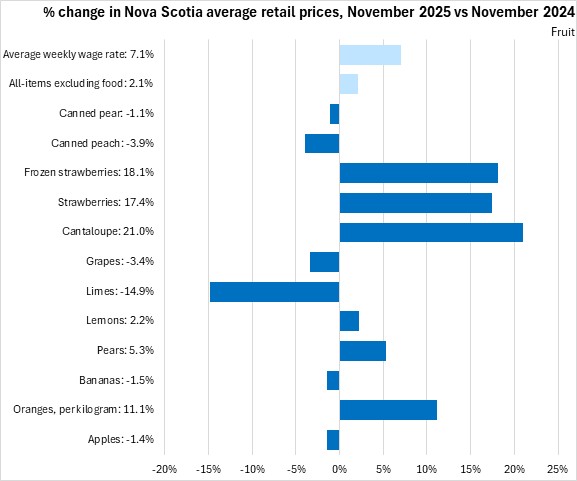
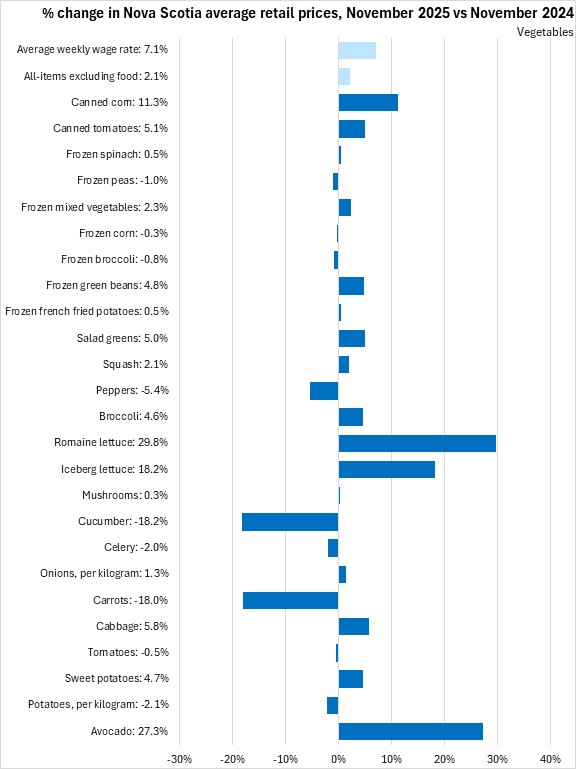
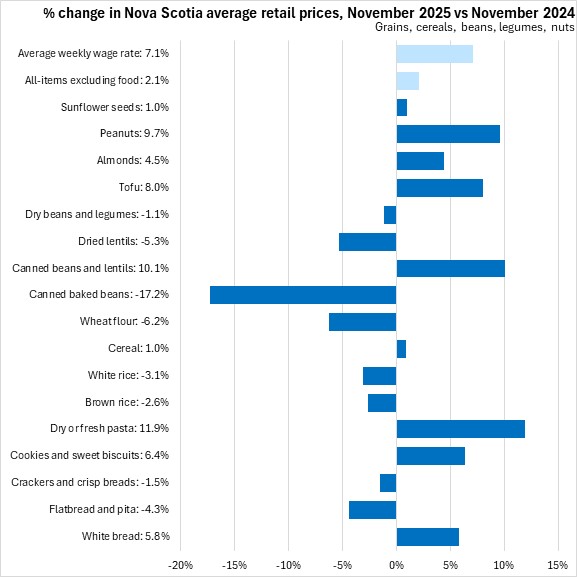
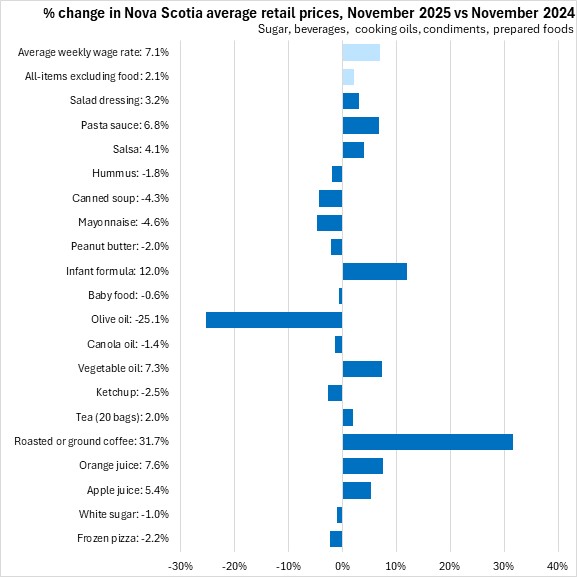
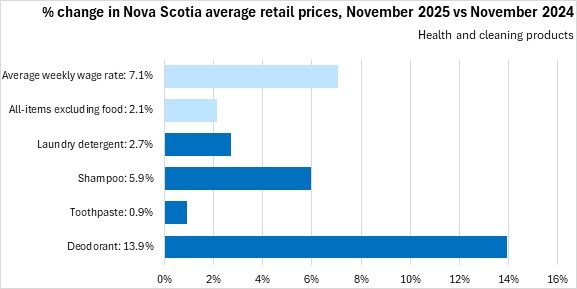
Over the last year (November 2025 vs November 2024), the consumer price index for all items in Nova Scotia excluding food increased by 2.1%. Food prices as a whole rose 3.4%. At the same time average weekly earnings across all Nova Scotia industries increased by 7.1%.
In the last year, the following products reported lower prices in Nova Scotia: beef rib cuts, chicken thigh, soy milk, margarine, block cheese, eggs, apples, bananas, limes, grapes, potatoes, tomatoes, carrots, celery, cucumber, peppers, frozen foods (broccoli, corn, peas, pizza), flatbread, crackers, rice (brown, white), wheat flour, white sugar, ketchup, canola oil, olive oil, baby food, peanut butter, mayonnaise, canned goods (baked beans, soup, peach, pear), lentils, beans/legumes, hummus
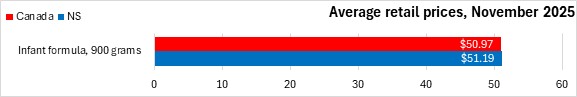
The following products reported price growth that exceeded the gains in average weekly earnings: beef (stewing, striploin, top sirloin, ground), pork (loin, rib), chicken (breasts, drumsticks), bacon, shrimp, canned tuna, meatless burgers, oranges, cantaloupe, strawberries, avocado, iceberg lettuce, romaine lettuce, frozen strawberries, pasta, orange juice, coffee, vegetable oil, infant formula, canned beans/lentils, canned corn, tofu, peanuts, deodorant

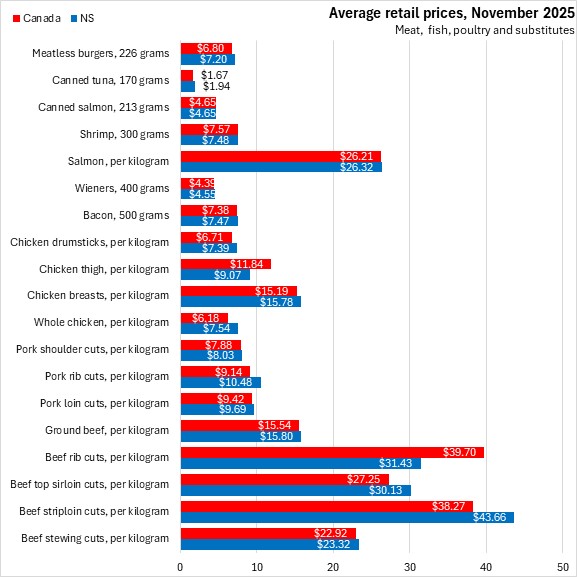
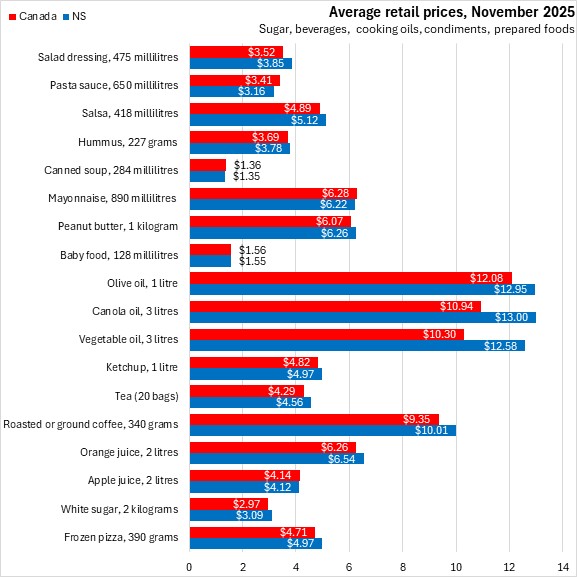
Nova Scotia prices relative to national average (November 2025)
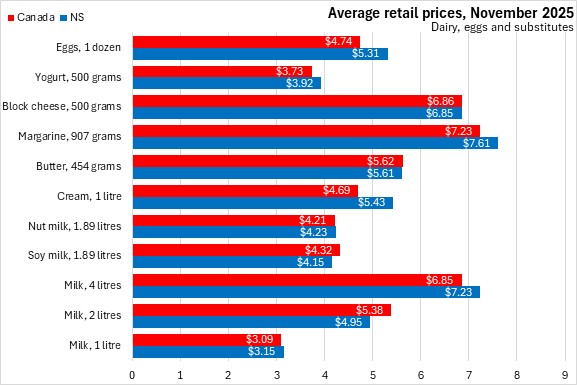
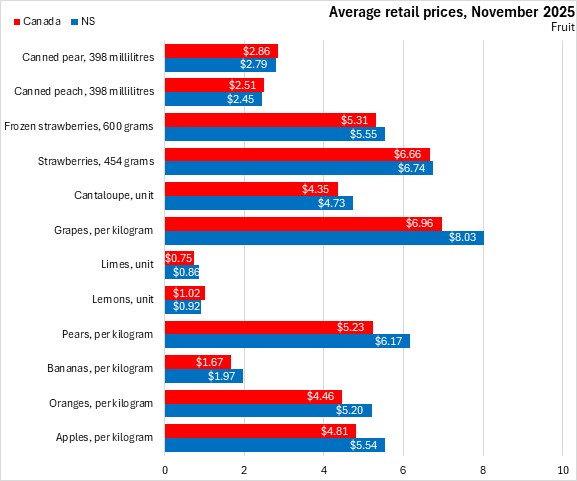
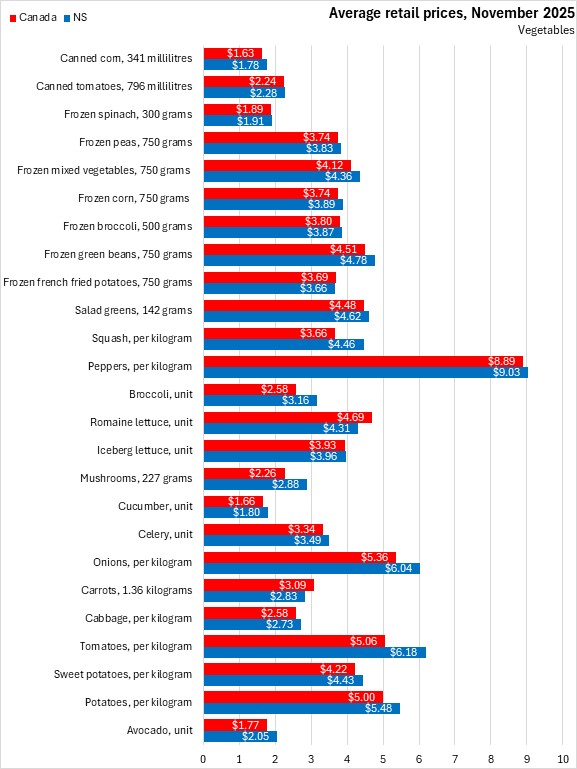
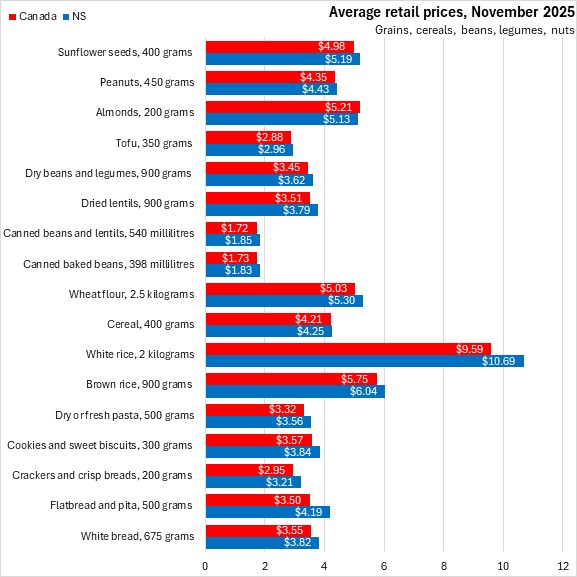
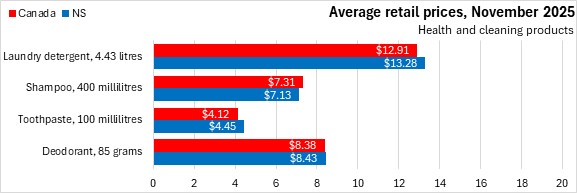
Nova Scotia food prices were below national averages for the following products: beef rib cuts, chicken thigh, shrimp, milk (2 litres), soy milk, butter, block cheese, lemons, carrots, romaine lettuce, frozen french fries, apple juice, baby food, mayonnaise, canned goods (soup, peach, pear), pasta sauce, almonds, shampoo
Nova Scotia food prices were more than 10% higher than the national averages for the following products: beef (striploin, top sirloin), pork rib cuts, chicken (whole, drumsticks), canned tuna, cream, eggs, apples, oranges, bananas, pears, limes, grapes, avocado, tomatoes, onions, mushrooms, broccoli, squash, flatbread, white rice, vegetable oil, canola oil
Notes: Statistics Canada makes available scanner data on prices collected for a range of food and personal care items. These prices are collected through point-of-sale (transaction) data obtained directly from Canadian retailers. The data represent commonly purchased items (which do change over time), but are not representative of the Consumer Price Index weights. Over time, products are rotated and quantity or quality October change. Comparisons of prices from one time period to another reflect quantity and quality changes as well as price changes.
For the purposes of this analysis, the 110 items reported by Statistics Canada will be grouped into:
- Meat, fish, poultry and meat substitutes
- Dairy, eggs and substitute products
- Fruit (including canned and frozen products)
- Vegetables (including canned and frozen products)
- Grains, cereals, beans, legumes and nuts
- Sugar, juices, cooking oils, condiments and prepared foods
- Health and cleaning products
Source: Statistics Canada. Table 18-10-0245-01 Monthly average retail prices for selected products; Table 18-10-0004-01 Consumer Price Index, monthly, not seasonally adjusted