For additional information relating to this article, please contact:
February 19, 2026CANADA TRADE BALANCE, DECEMBER AND ANNUAL 2025 Month-over-month (December 2025 vs November 2025)
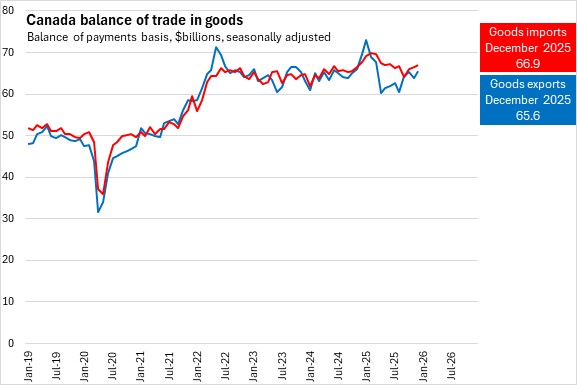
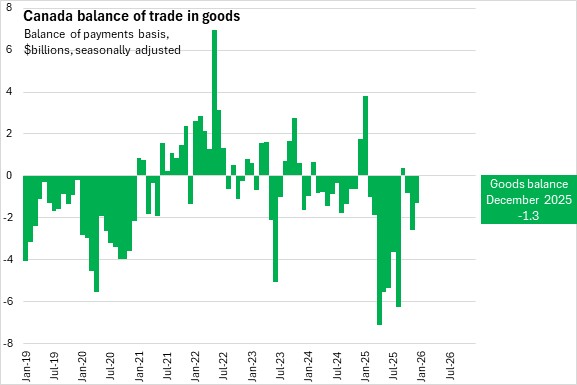
In December 2025, Canada's international exports of goods grew 2.6% to $65.6 billion. Canada’s goods imports were up 0.6% to $66.9 billion. Canada's goods trade deficit narrowed to $1.3 billion in December.
Exports were up on a large increase in exports of metal and non-metallic mineral products while seven of eleven product sections declined. Excluding exports from this group, total exports were down 0.2% in December. There was also a notable increase in exports of aircraft and other transportation equipment, including engines/parts/other aerospace equipment to the United States. Imports were up in six of eleven product sections in December, led by growth in motor vehicles and parts imports, with higher imports of passenger cars and trucks from countries other than the United States.
In real (or volume) terms, exports and imports were both up 1.4% in December.
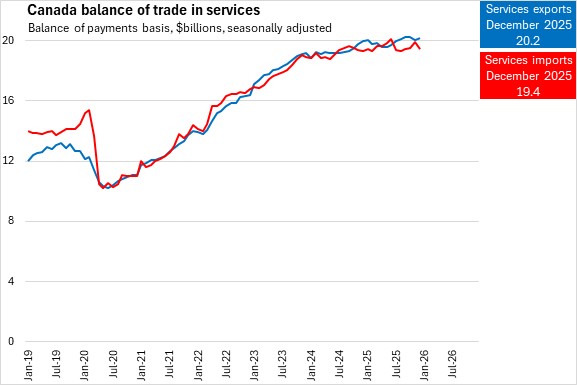
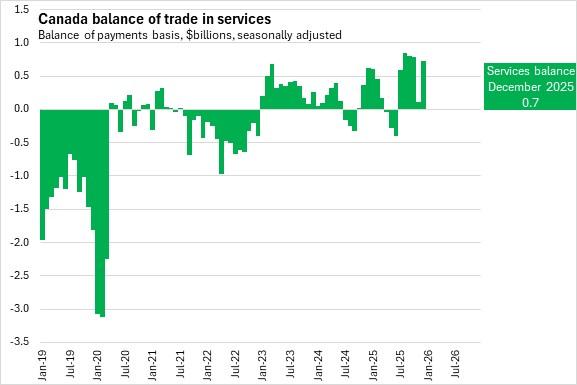
Canada's international exports of services grew 0.8% from the previous month to $20.2 billion in December 2025. Canada's imports of services were down 2.2% to $19.4 billion. As exports rose and imports declined, Canada's services trade surplus grew by $615 million to $733 million in December.
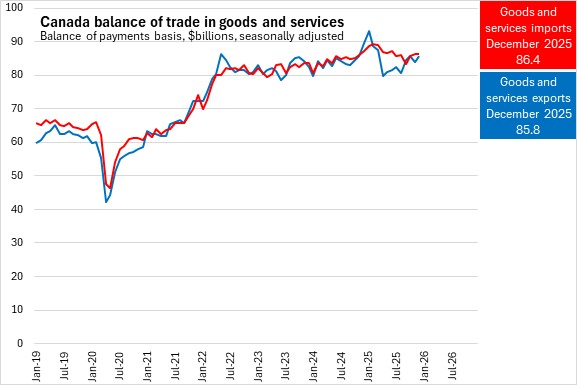
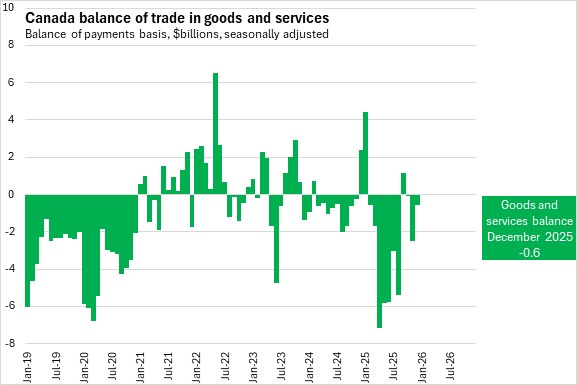
Canada’s international exports of goods and services grew 2.2% to $85.8 billion in December 2025. Canada's international imports of goods and services edged down 0.05% to $86.4 billion. Canada's overall international trade deficit improved by $1.9 billion to $0.6 billion in December 2025.
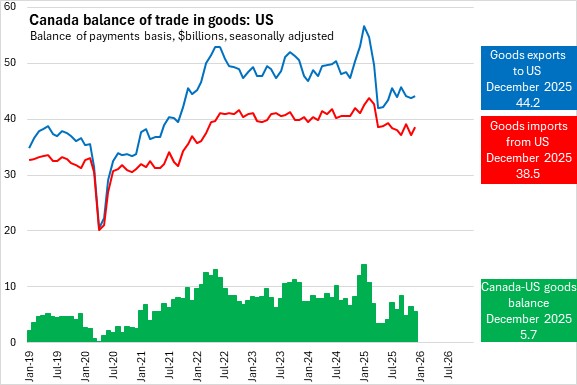
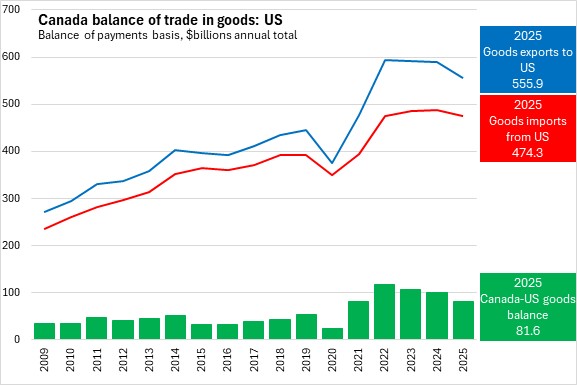
Significant changes in US tariff policy led to a pre-tariff increase in Canadian goods exports to the US (building inventories of goods before tariffs take effect), followed by a sharp post-tariff decline. Retaliatory measures and changes in consumer preferences have also influenced Canadian imports of goods from the US during this period.
Exports of goods to the United States from Canada grew 1.1% to $44.2 billion in December 2025 while imports of goods from the US grew 3.5% to $38.5 billion. Canada's trade surplus in goods with the US narrowed by $0.8 billion to $5.7 billion in December 2025.
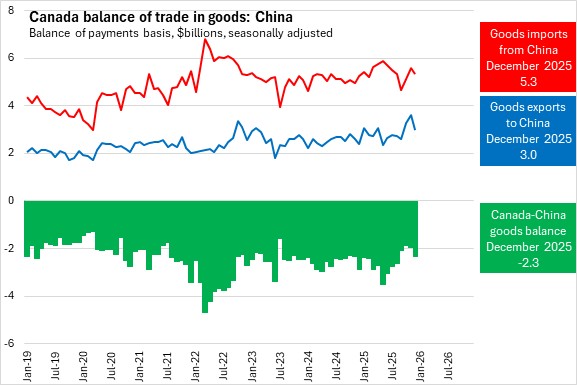
Canada's exports of goods to China declined 17.5% to $3.0 billion in December 2025. Canada's imports of goods from China fell 4.4% to $5.3 billion. Canada's deficit in goods trade with China widened by $389 million to $2.3 billion.
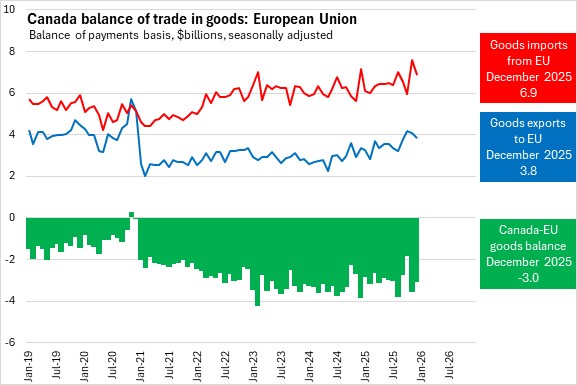
In December 2025, Canada's exports of goods to the European Union declined 5.4% to $3.8 billion. Canada's imports of goods from the EU fell 9.6% to $6.9 billion. Canada's deficit in goods trade with the EU narrowed by $508 million to $3.0 billion.
Year-over-year (December 2025 vs December 2024)
Compared with the same month in 2024:
- Canada's international exports of goods declined 5.7% (-$4.0 billion) while Canada’s goods imports fell 1.3% (-$0.9 billion). As export declines outpaced that of imports, Canada's goods trade position deteriorated by $3.1 billion, moving from a surplus of $1.8 billion in December 2024 to a deficit of $1.3 billion.
- Canada's international exports of services were up 1.2% (+$238 million) while Canada's imports of services rose by 0.7% (+$130 million). With a larger increase in exports than imports, Canada's services trade surplus increased by $108 million.
- Canada’s combined international exports of goods and services declined by 4.2% (-$3.7 billion) while imports of goods and services declined by 0.9% (-$0.8 billion). Canada's overall international trade position deteriorated by $3.0 billion, moving from a surplus of $2.4 billion in December 2024 to a deficit of $0.6 billion.
- Exports of goods from Canada to the United States decreased 16.7% (-$8.8 billion) while imports of goods from the US fell 6.2% (-$2.6 billion). Canada's trade surplus in goods with the US contracted by $6.3 billion.
- Canada's exports of goods to China rose 25.8% (+$613 million). Canada's imports of goods from China rose 1.5% (+$78.6 million). Canada's deficit in goods trade with China narrowed by $533.8 million.
- Canada's exports of goods to the European Union rose by 15.1% (+$503.4 million). Canada's imports of goods from the EU fell by 3.7% (+$266.2 million). Canada's deficit in goods trade with the EU narrowed by $769.5 million.
Annual (2025 vs 2024)
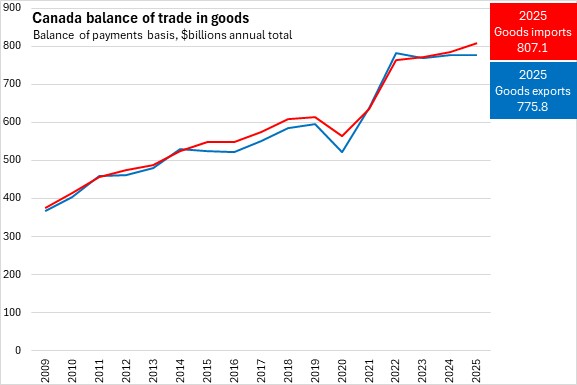
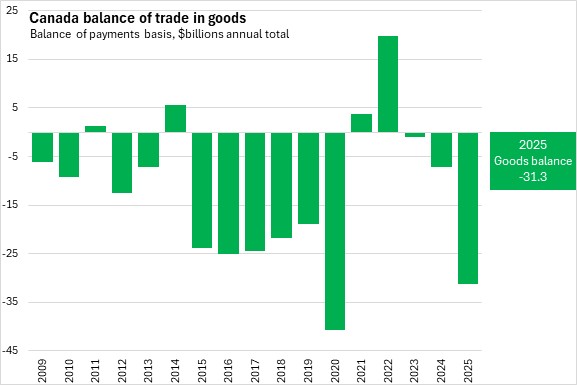
In 2025, Canada's exports of goods declined 0.2% to $775.8 billion while imports of goods increased 2.8% to $807.1 billion. Canada's international goods trade deficit increased by $24.1 billion to $31.3 billion in 2025.
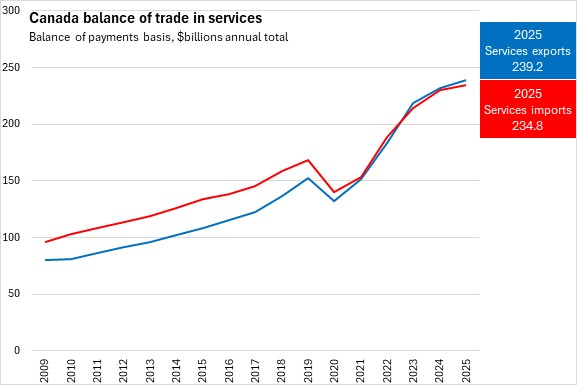
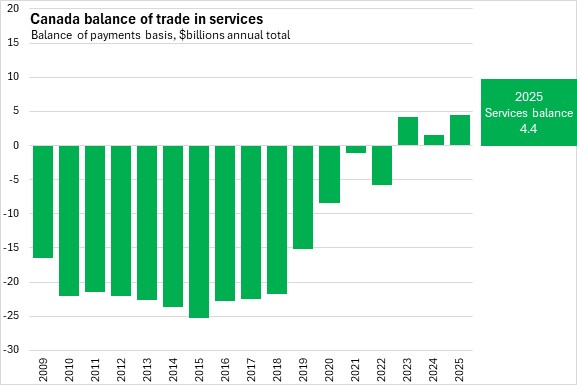
In 2025, Canada's exports of services increased 3.2% to $239.2 billion while imports of services increased 2.0% to $234.8 billion. With a greater increase in exports than imports, Canada's international services trade surplus grew by $2.9 billion to $4.4 billion in 2025.
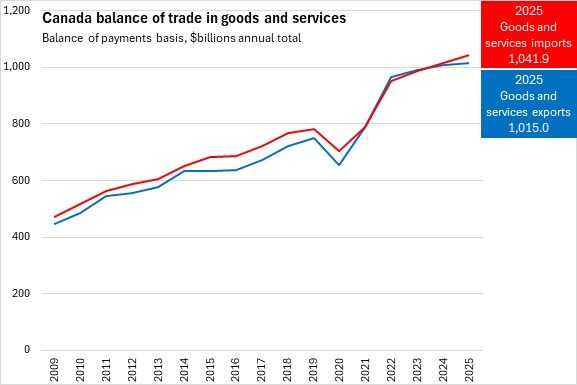
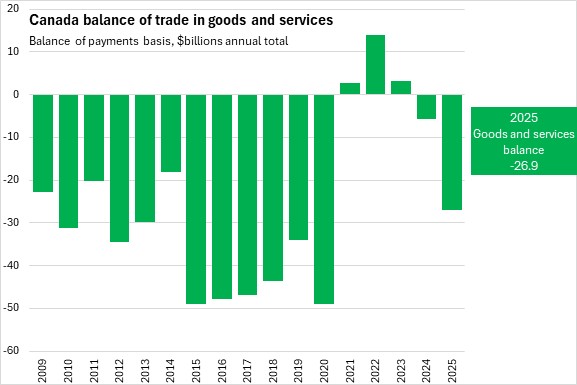
Exports of goods and services increased 0.6% to 1,015 billion while imports increased 2.7% to 1,042 billion in 2025. As imports grew faster than exports, Canada's international goods and services deficit increased by $21.2 billion to $26.9 billion in 2025.
Canada's goods exports to the US decreased 5.8% to $555.9 billion while imports fell 2.9% to $474.3 billion in 2025. The goods trade surplus to the US contracted by $19.7 billion to $81.6 billion in 2025.
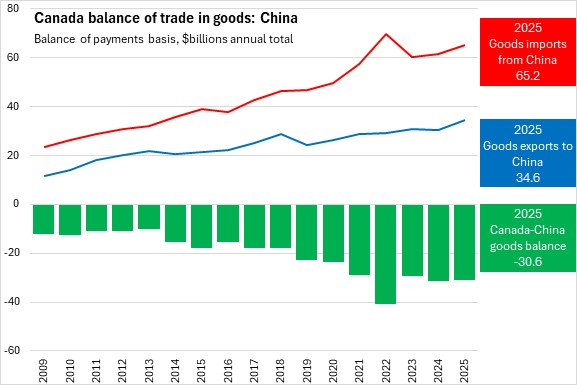
Canada's goods exports to China increased 14.0% to $34.6 billion while imports grew 6.2% to $65.2 billion in 2025. As export growth outpaced import growth, Canada's goods trade deficit with China contracted by $465 million to $30.6 billion in 2025.
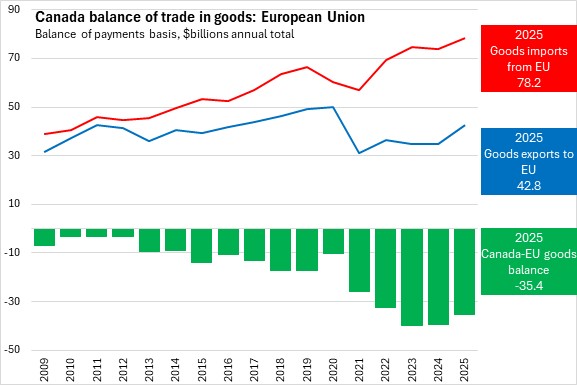
Canada's goods exports to the European Union increased 23.4% to $42.8 billion while imports grew 5.7% to $78.2 billion in 2025. As export growth outpaced import growth, Canada's goods trade deficit with the European Union contracted by $3.9 billion to $35.4 billion in 2025.
Source: Statistics Canada, Table 12-10-0011-01 International merchandise trade for all countries and by Principal Trading Partners, monthly (x 1,000,000); Table 12-10-0121-01 International merchandise trade by commodity, monthly (x 1,000,000); Table 12-10-0144-01 International trade in services, monthly (x 1,000,000)