For additional information relating to this article, please contact:
March 02, 2026SURVEY ON BUSINESS CONDITIONS: Q1 2026 Statistics Canada has conducted its 22nd iteration of the Canadian Survey on Business Conditions. In January and early February, Statistics Canada surveyed businesses to collect information on businesses' expectations, obstacles, plans and practices.
The results reported here are a selection of the impacts found for Nova Scotia businesses, by industry, by size of business (measured by number of employees), by age of business and by urban or rural location. There are comparisons of the Nova Scotia average (all industries, ages, sizes, locations) with the national and provincial averages. The horizontal axis in all charts measures the share of businesses reporting each outcome. The total for many outcomes does not add to 100% of respondent businesses as many replied that the outcome was not applicable in their circumstances, or data were suppressed.
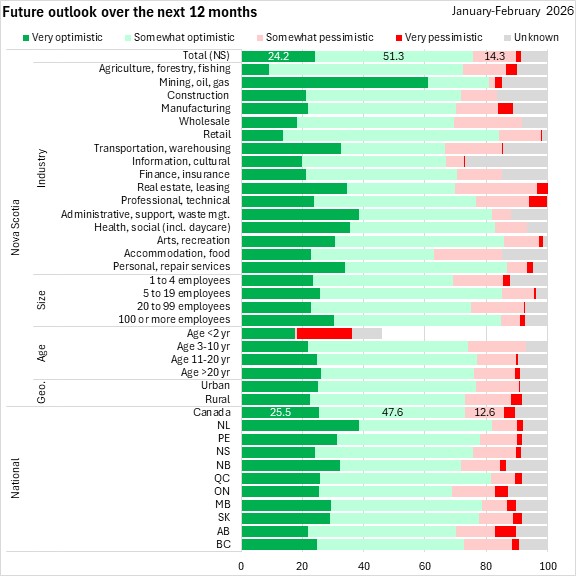
Future outlook over the next 12 months
In Nova Scotia, 24.2% of businesses were very optimistic about the next 12 months; a further 51.3% were somewhat optimistic, 14.3% were somewhat pessimistic and 1.6% were very pessimistic. Business optimism was similar at the national level, with higher optimism in Newfoundland and Labrador and Prince Edward Island.
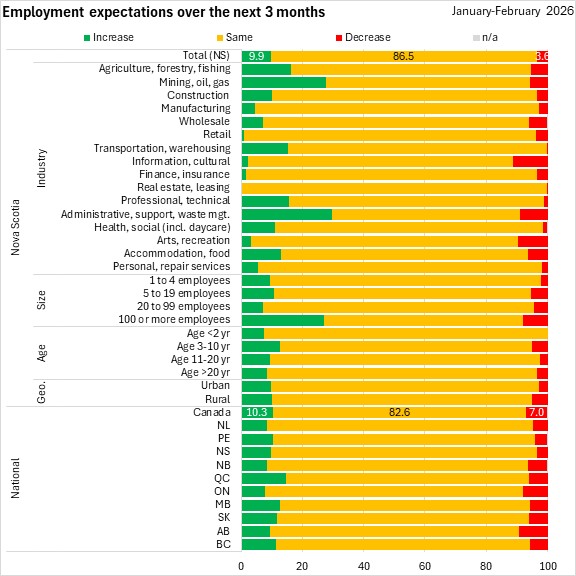
Business expectations for the next three months
The outlook for employment was stable for 86.5% of Nova Scotia businesses in the next three months. Rising employment is expected among 9.9% of Nova Scotia businesses while declining employment is expected by 3.6% of Nova Scotia businesses.
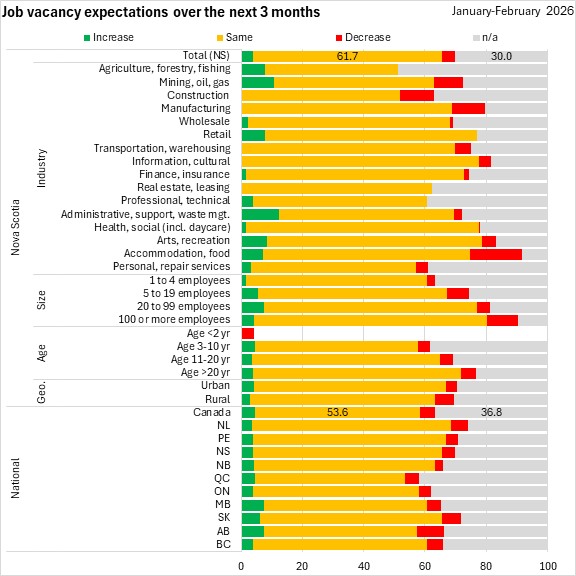
Most businesses in Nova Scotia (61.7%) expect stable job vacancies with more expecting declining vacancies (4.4%) than increasing vacancies (3.8%).
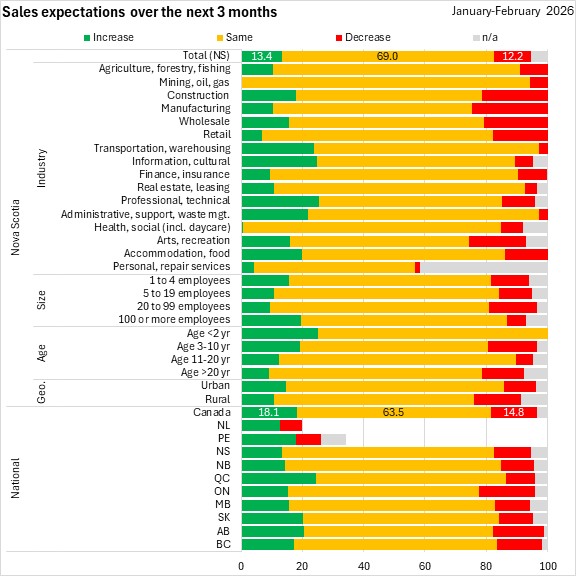
The majority of businesses in Nova Scotia (69.0%) expect stable sales while 13.4% expect rising sales and 12.2% expect declining sales.
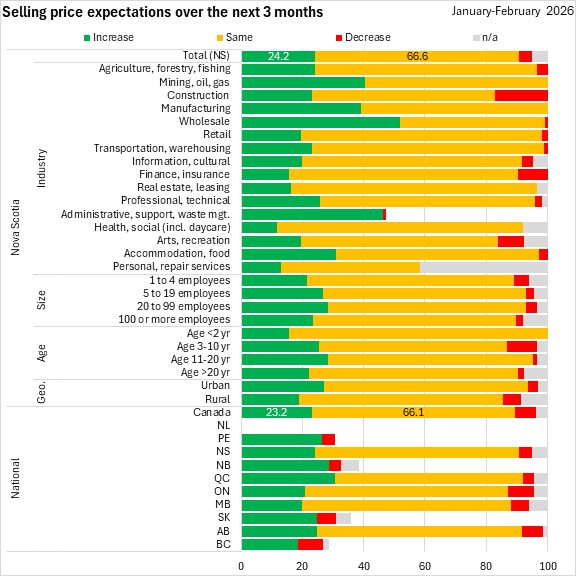
Prices are expected to be stable for 66.6% of Nova Scotia businesses while 24.2% expect rising prices, an increase from the prior quarter. A further 4.0% of Nova Scotia businesses expect declining prices.
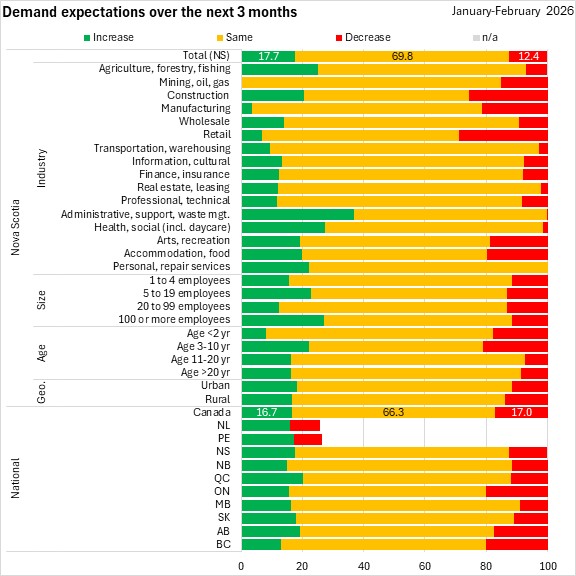
Over two-thirds (69.8%) of Nova Scotia businesses expect stable demand while 17.7% expect increasing demand and 12.4% expect declining demand.
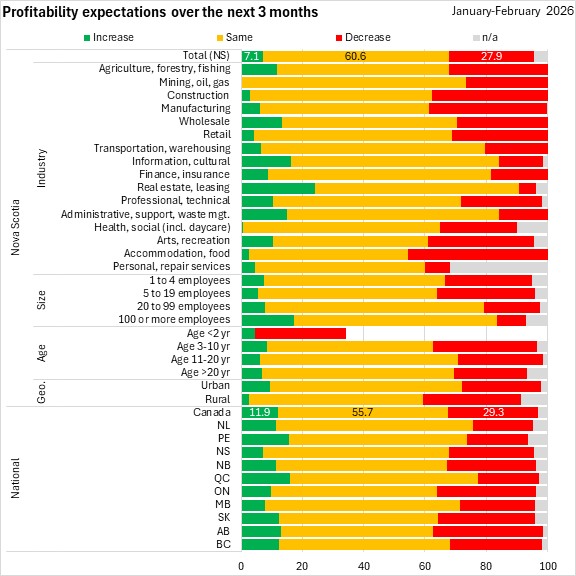
Stable profitability is expected by 60.6% of Nova Scotia businesses. Expectations of falling profitability (27.9%) outweighed expectations of rising profitability (7.1%).
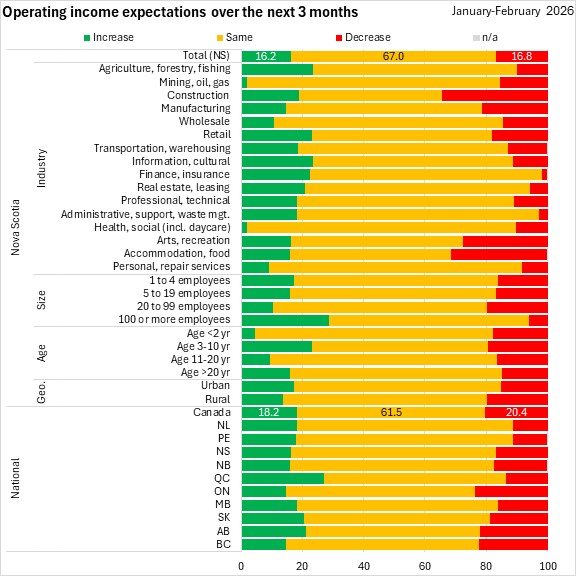
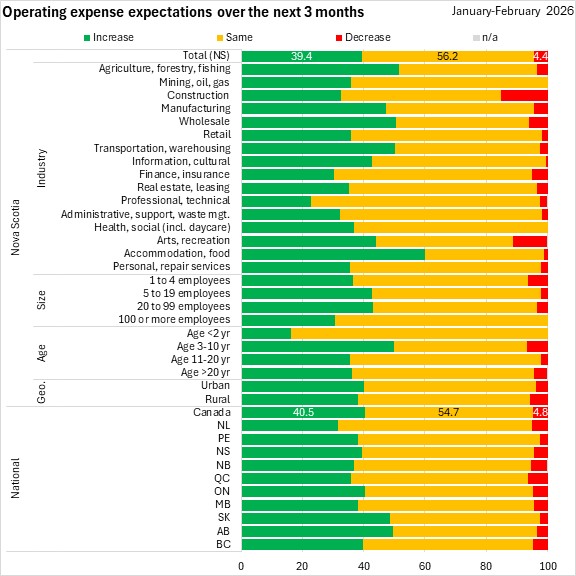
Rising operating income is expected by 16.2% of Nova Scotia businesses while higher operating expenditures are expected by 39.4% of Nova Scotia businesses. Stable operating income is expected by 67.0% of Nova Scotia businesses. Stable operating expenditures were expected by 56.2% of Nova Scotia businesses. Declining operating revenues are expected by 16.8% of Nova Scotia businesses while only 4.4% expect declining operating expenses.
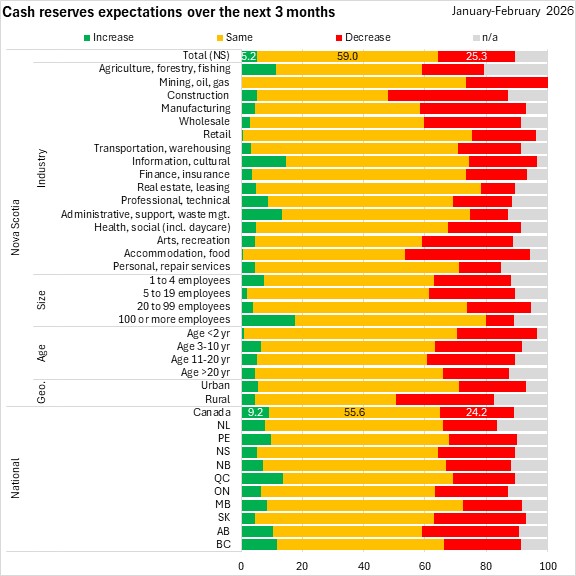
Cash reserves are expected to remain stable for 59.0% of Nova Scotia businesses while 5.2% expect rising cash reservices and 25.3% expect falling cash reserves.
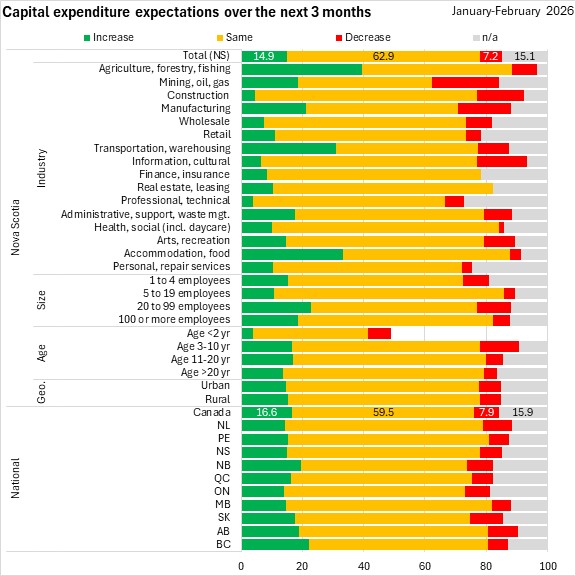
Capital expenditures are expected to be stable for 62.9% of Nova Scotia businesses; rising for 14.9% and falling for 7.2%.
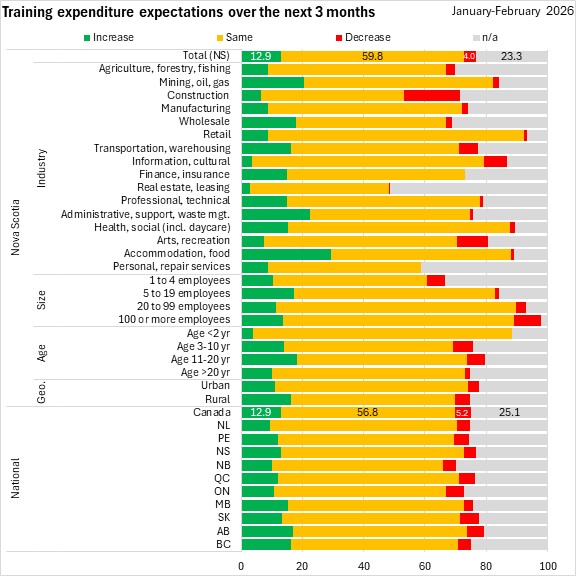
Training expenditures are expected to be stable for 59.8% of Nova Scotia businesses while 12.9% expect higher expenditures on training.
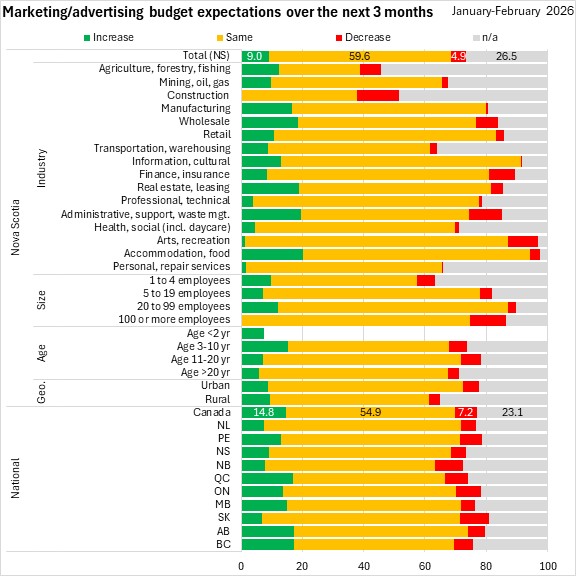
Over half of businesses in Nova Scotia (59.6%) expect stable marketing expenditures in the next three months while 9.0% expect rising marketing expenditures and 4.9% anticipate falling marketing/advertising spending..
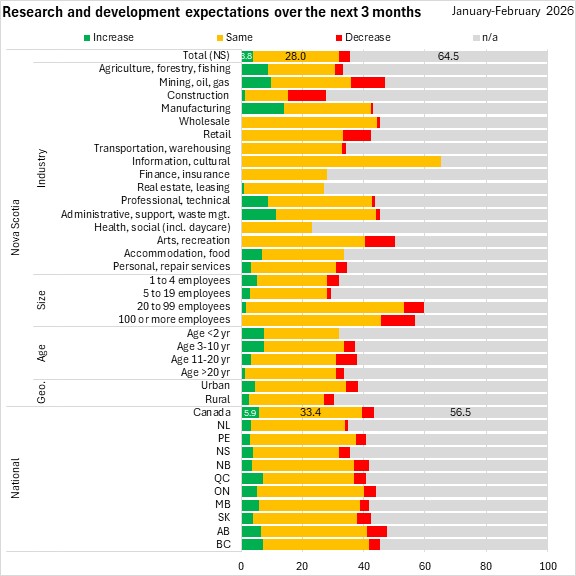
Although research and development (R&D) expenditures are not relevant for the majority of businesses (64.5%), most businesses that conduct R&D expect stable spending (28.0%) in the next three months.
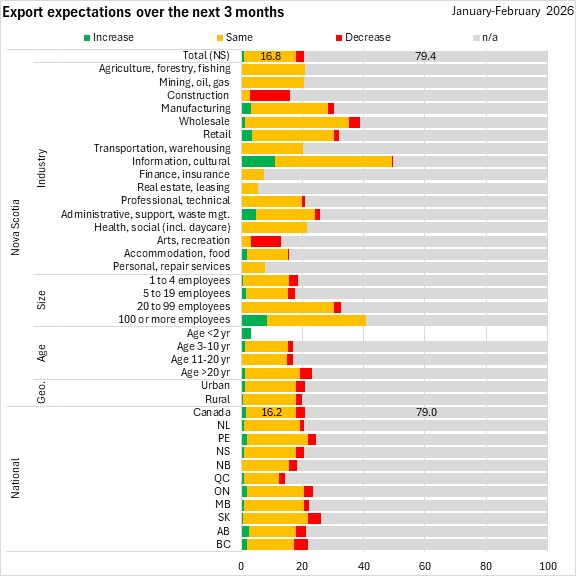
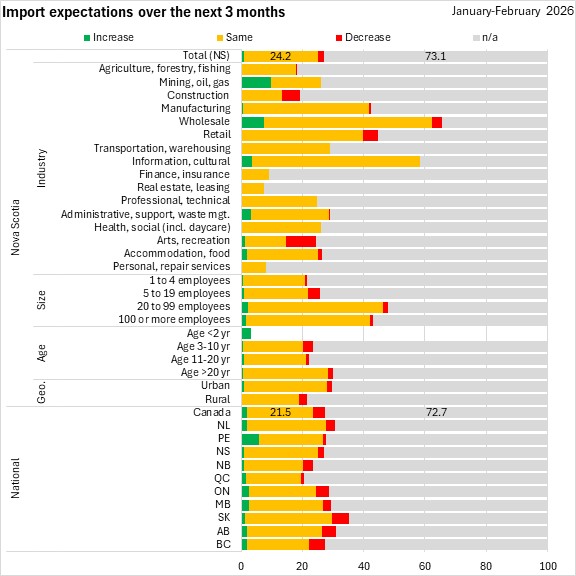
Although few Nova Scotia businesses participate directly in international trade, the majority of these expect stable imports and exports in the next three months.
Obstacles for businesses
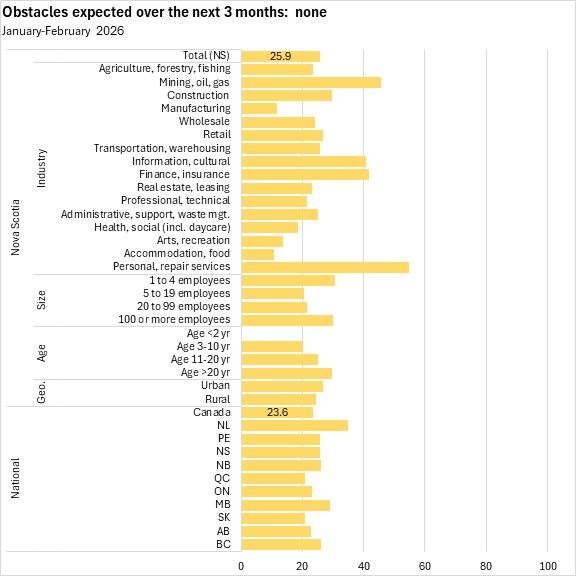
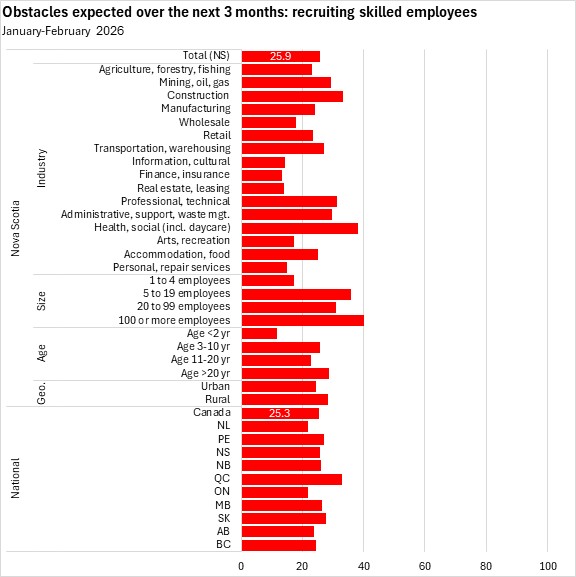
As part of the Survey of Business Conditions, businesses were asked about their obstacles. Among Nova Scotia businesses, 25.9% reported no substantial obstacles expected in the next three months (up from the previous quarter). Across Canada, 23.6% of businesses reported no obstacles.
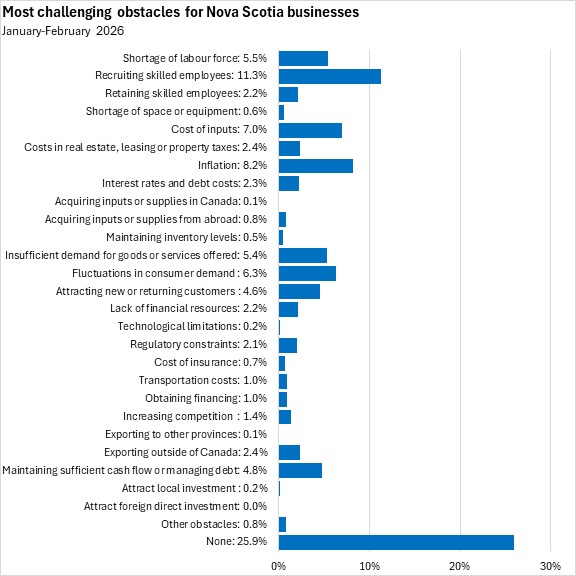
When asked what was the one most pressing obstacle for Nova Scotia businesses (across all industries), recruiting skilled employees (11.3%) and inflation (8.2%) were the most widely reported.
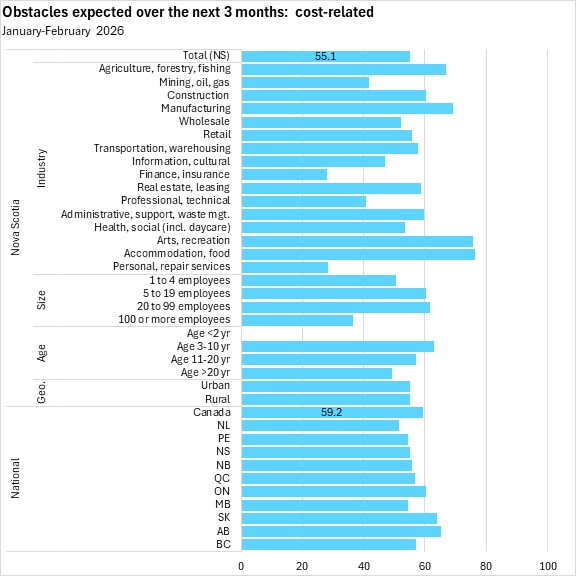
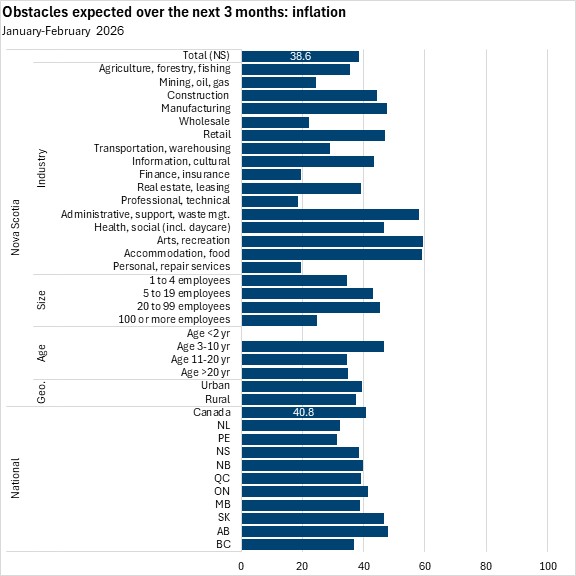
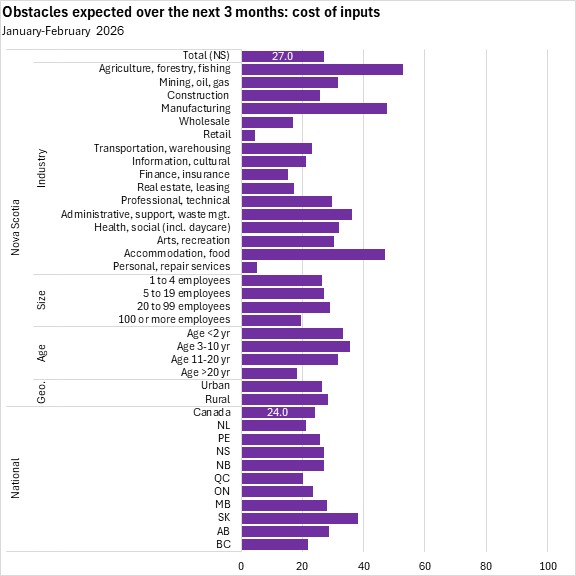
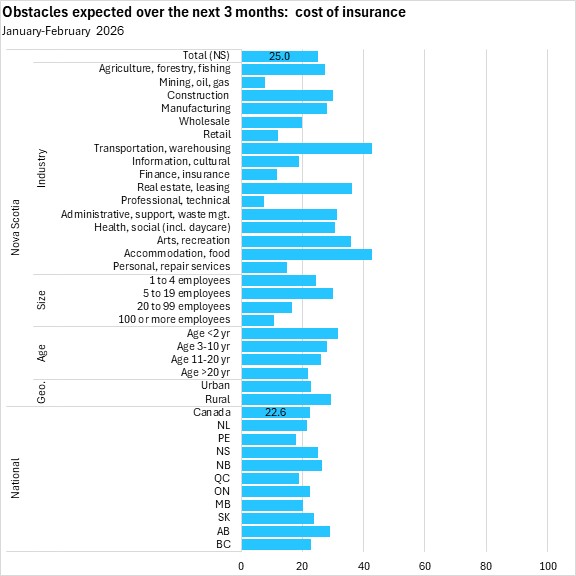
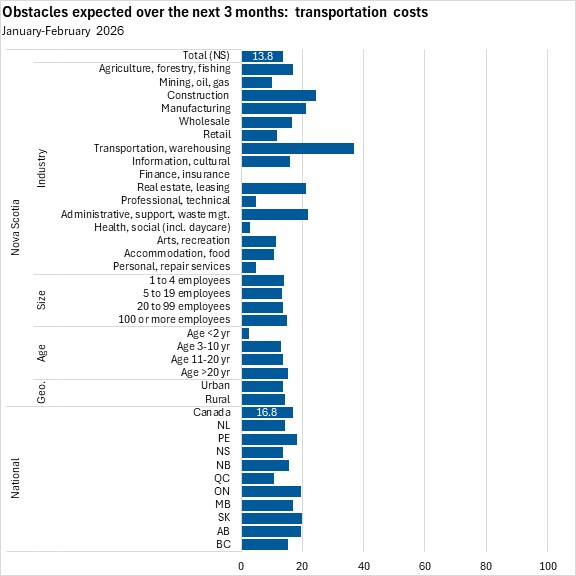
The most acutely-felt obstacles in Q4 2025 were cost-related. Obstacles in this category were reported by 55.1% of Nova Scotia businesses. General inflation (38.6%), input costs (27.0%) and cost of insurance (25.0%) were the most widely reported cost obstacles .
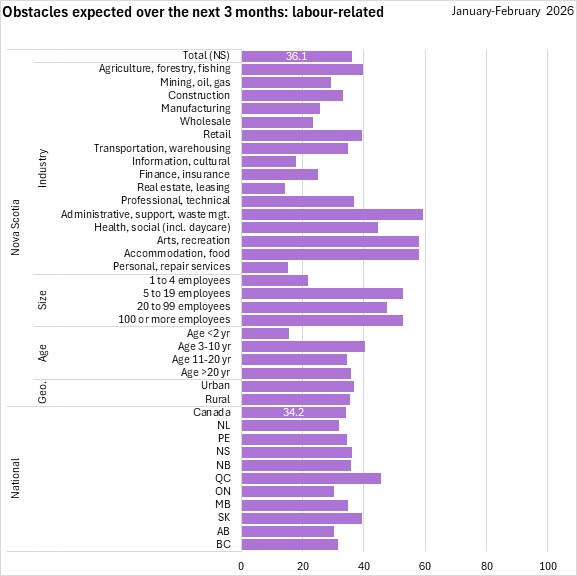
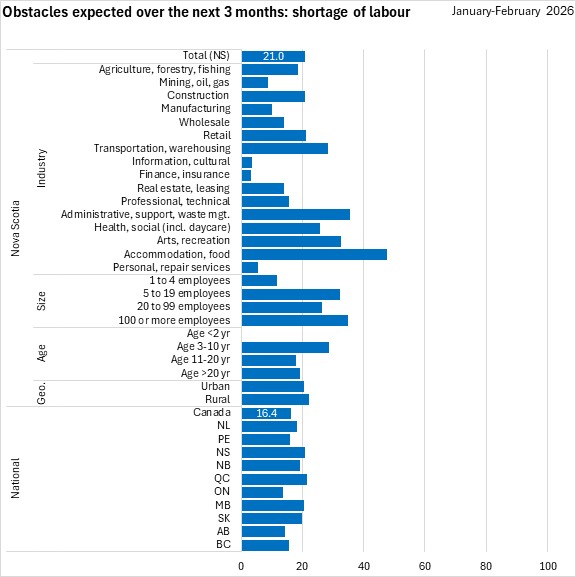
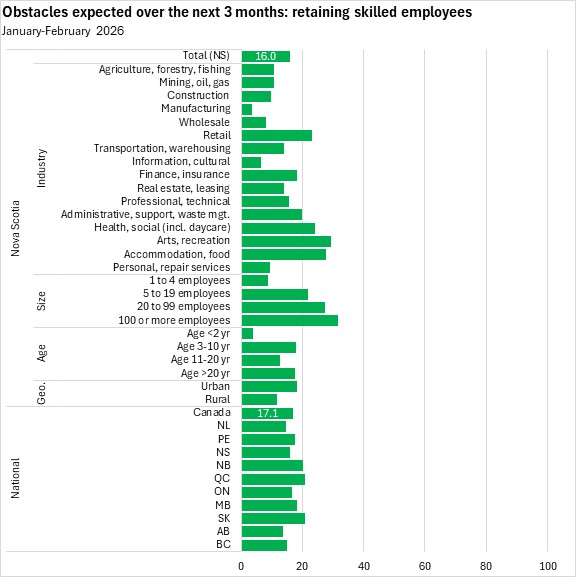
Labour-related obstacles were reported by 36.1% of Nova Scotia businesses, including: labour force shortages (21.0%) as well as recruiting (25.9%) and retaining (16.0%) skilled employees.
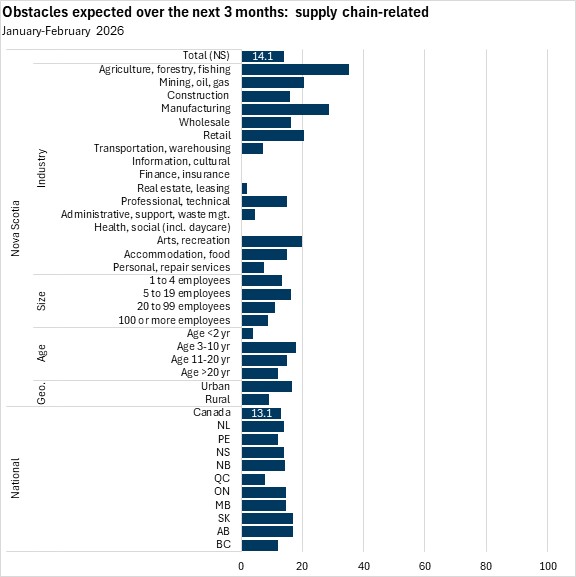
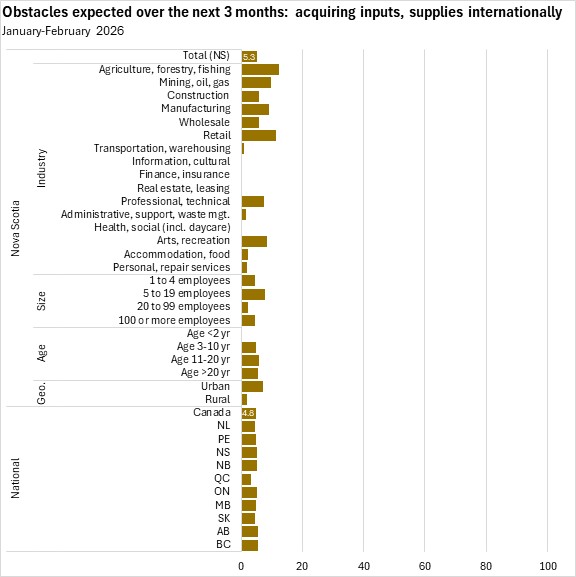
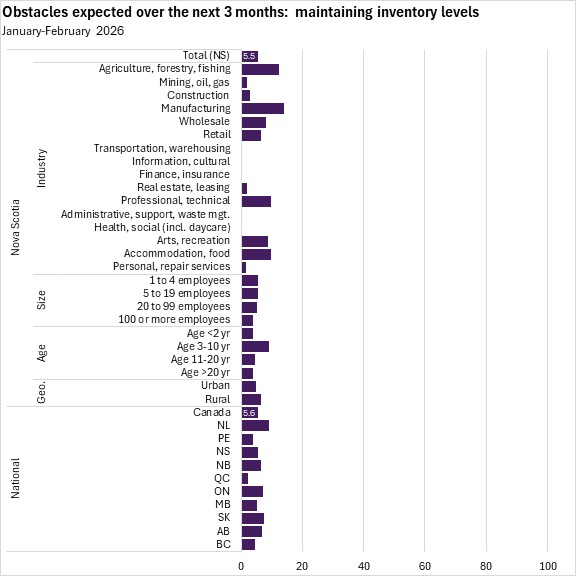
Supply-chain issues were reported as business obstacles by 14.1% of Nova Scotia's businesses.
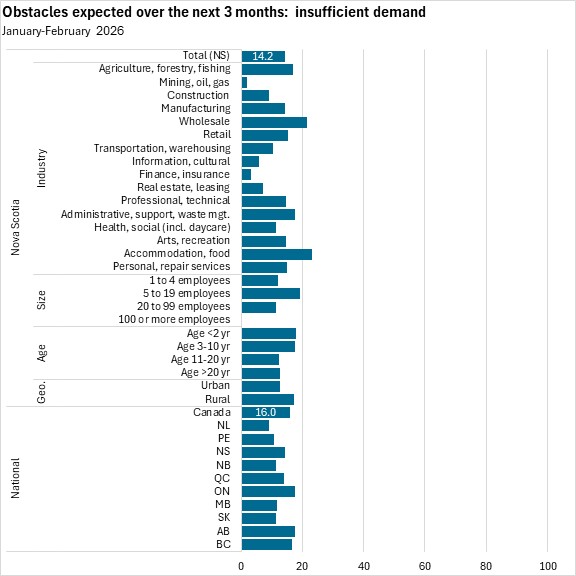
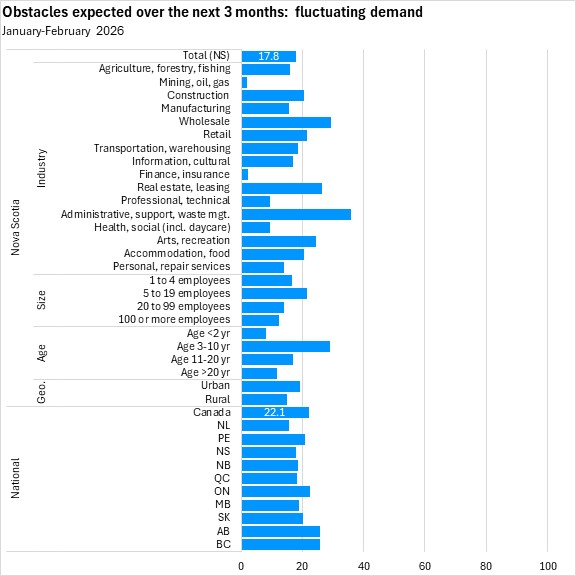
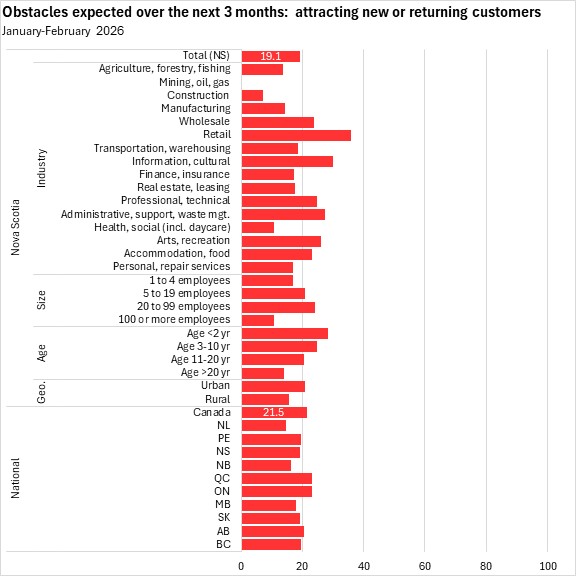
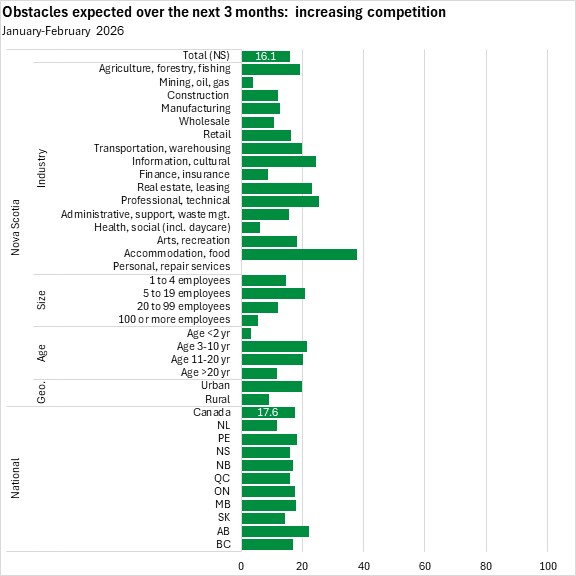
Market conditions, such as increasing competition (16.1%), insufficient demand (14.2%), fluctuating demand (17.8%) and attracting new customers (19.1%) were also somewhat frequently reported obstacles for Nova Scotia businesses.
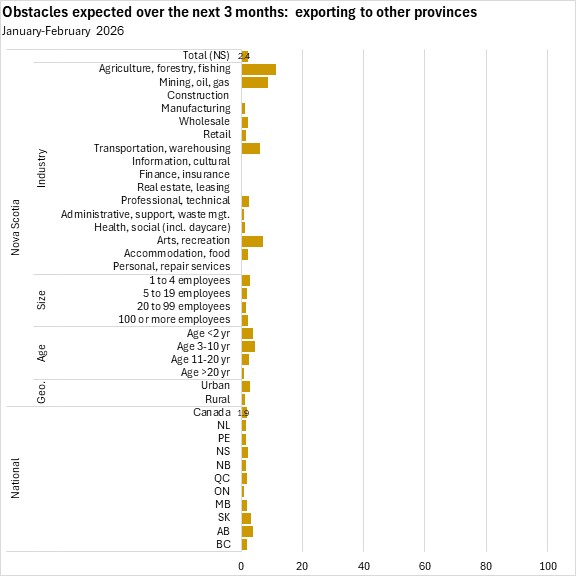
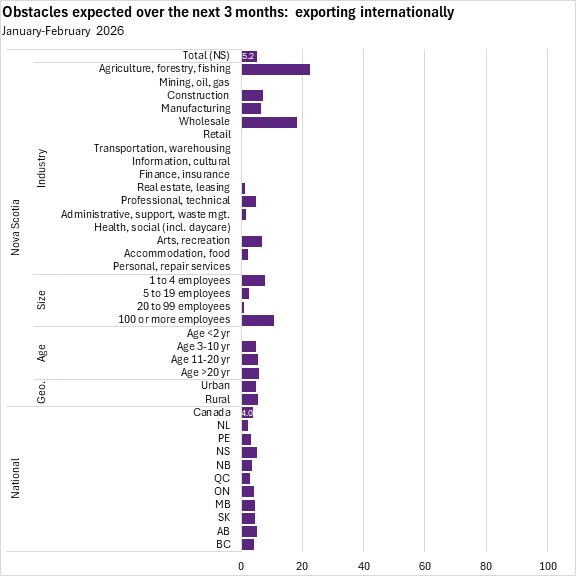
Exporting to other provinces (2.4%) and other countries (5.2%) were less frequently cited obstacles, considering that many Nova Scotia businesses do not participate in interprovincial or international trade.
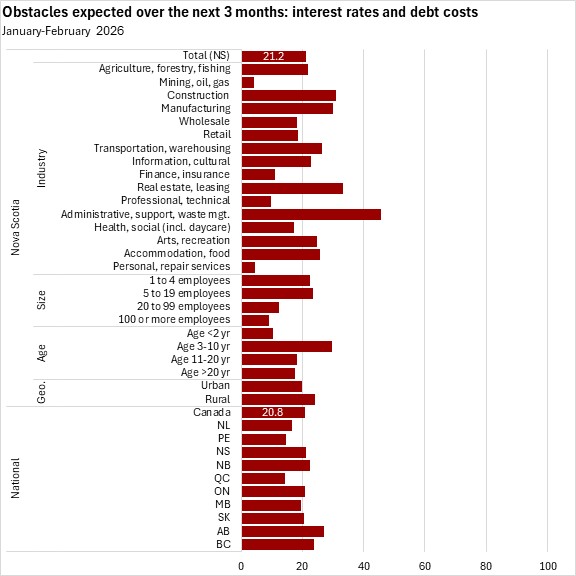
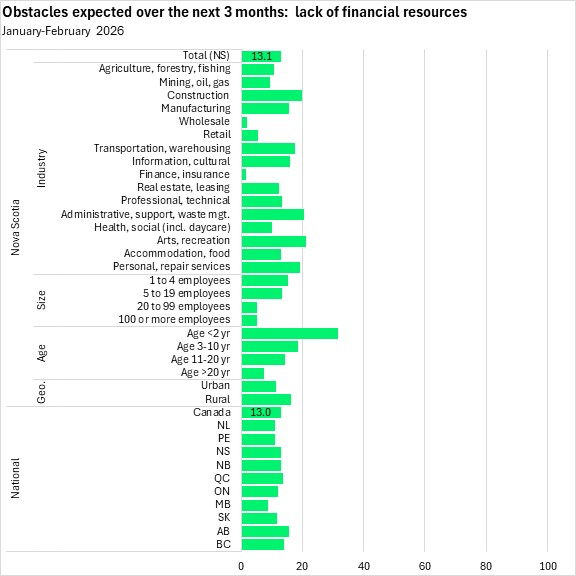
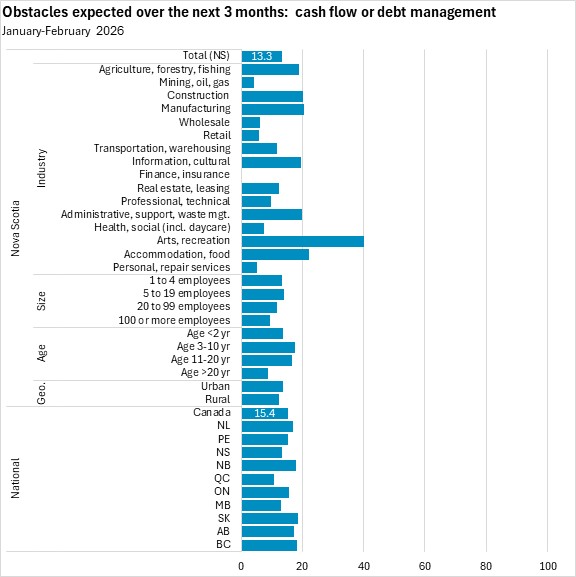
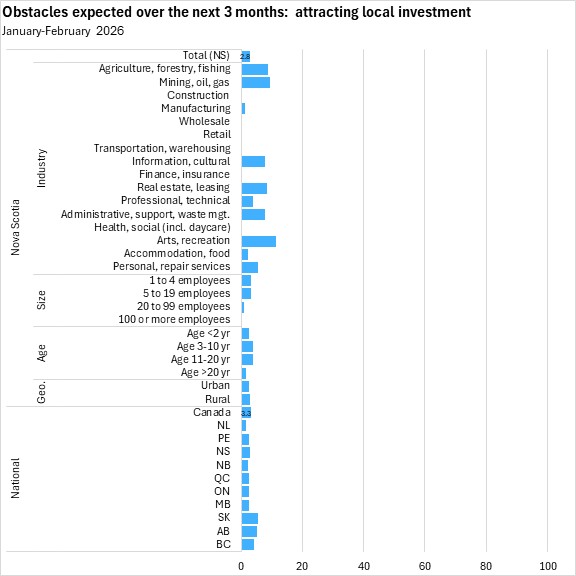
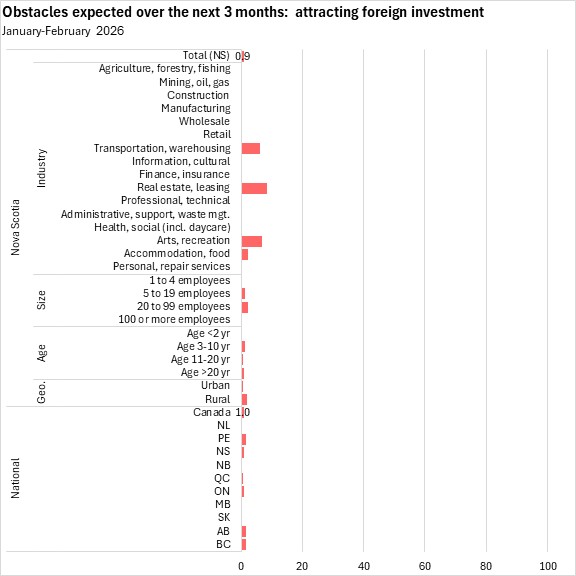
Lack of financial resources (13.1%) and cash flow/debt management (13.3%) were more frequently-cited financial obstacles than attracting investment.
Regulatory constraints were cited as an obstacle by 11.6% of Nova Scotia businesses, with a notable concentration among resource and construction businesses. Regulatory barriers were a more widely cited obstacle than in every province except British Columbia.

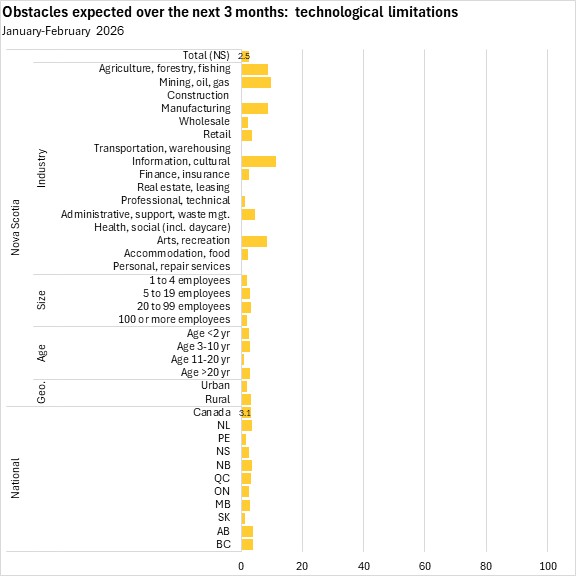
Technological limitations were an infrequently-noted business obstacle (2.5%).
Financial conditions
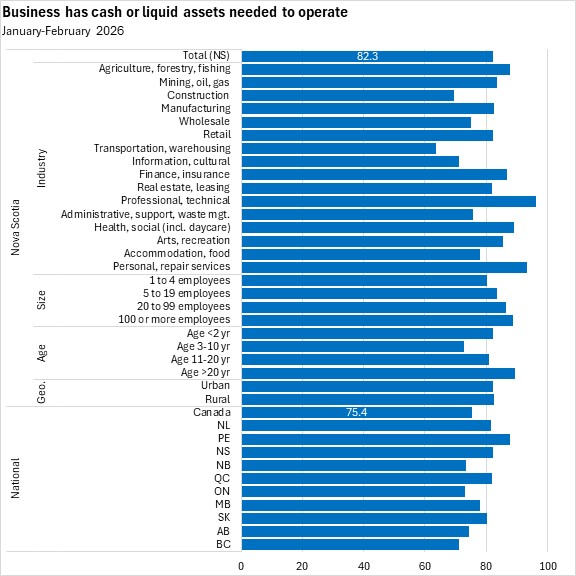
In Nova Scotia, 82.3% of businesses reported having sufficient cash or liquid assets needed for operations. This was above the national average (75.4%).
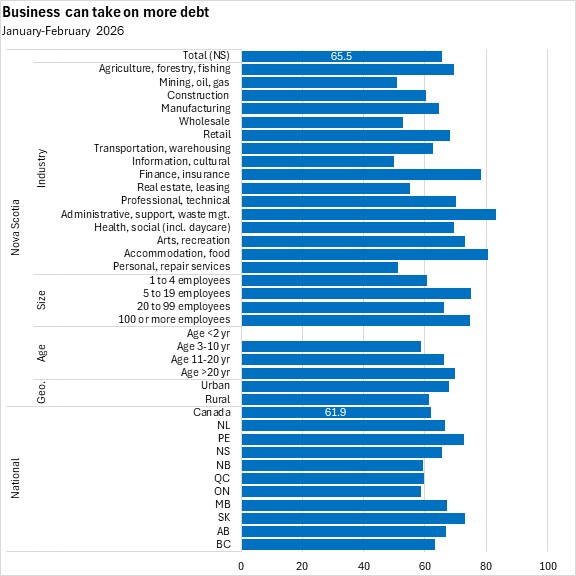
Almost two-thirds of businesses in Nova Scotia (65.5%) report that they could take on more debt if needed. This was higher than the national share (61.9%).
Impacts of US tariffs
In Q1 2026, Nova Scotia businesses were again asked questions about how the changing trade and tariff landscape is having an impact on business operations and results.
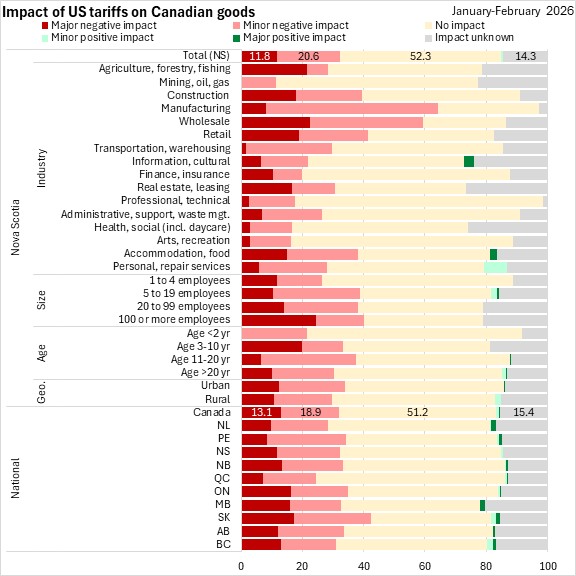
The majority of Nova Scotia firms reported no impact (52.3%) or unknown impacts (14.3%) from changes to US tariffs on Canadian goods. Among those that reported impacts, the vast majority reported minor negative impacts (20.6%) or major negative impacts (11.8%).
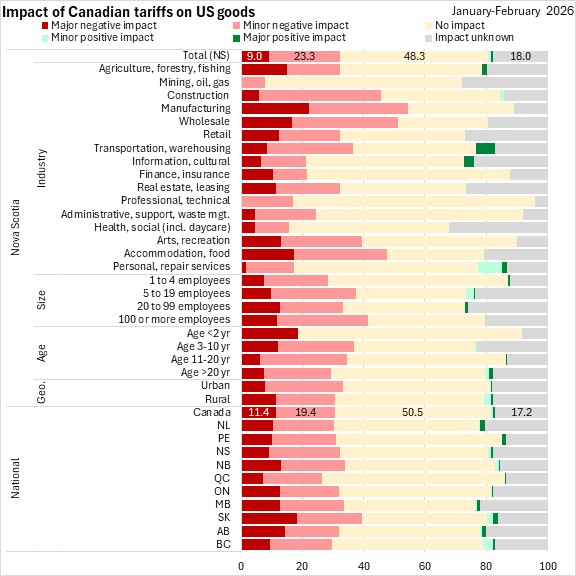
The impacts of Canadian tariffs on US goods caused major negative impacts for 9.0% of Nova Scotia businesses and minor negative impacts for 23.3%. Among the remainder of Nova Scotia businesses, most reported no impact (48.3%) or unknown impact (18.0%).
Interprovincial trade
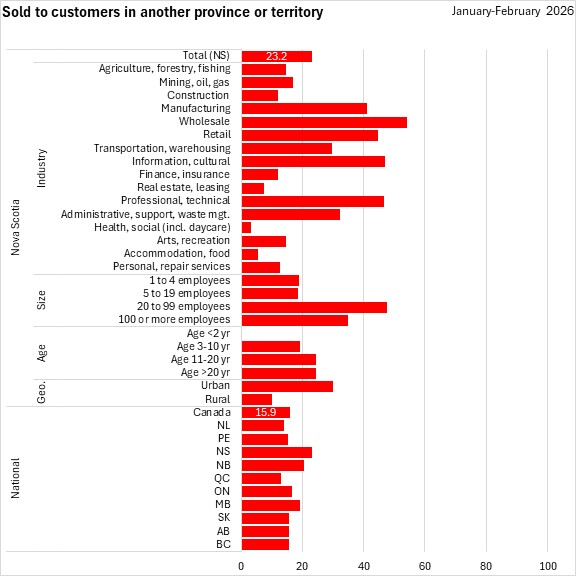
In Q1 2026, 23.2% of Nova Scotia businesses reported selling to customers in another province or territory. This was higher than in any other province.
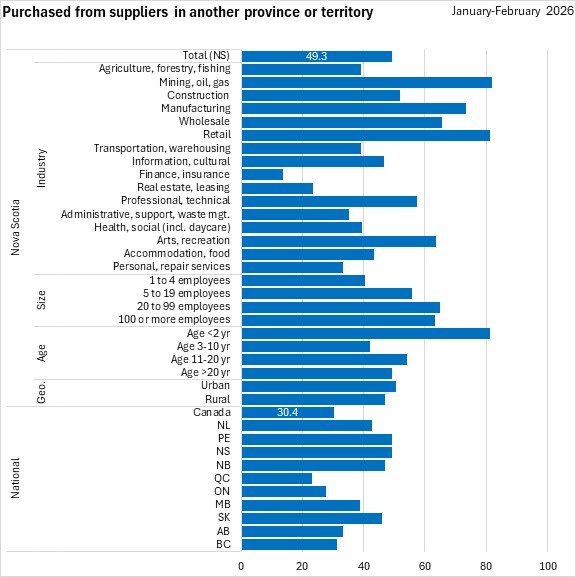
A further 49.3% of Nova Scotia businesses reported sourcing inputs from suppliers in other provinces or territories, which was tied with Prince Edward Island for the highest among provinces.
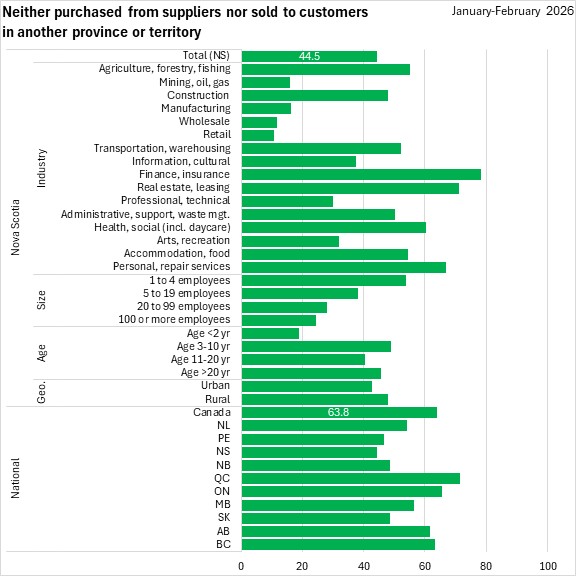
Overall, Nova Scotia had the lowest portion of businesses that had no participation in interprovincial trade (44.5%).
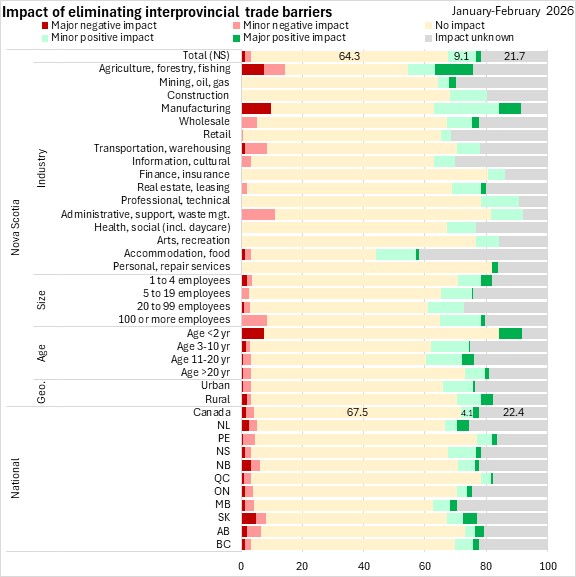
Elimination of interprovincial trade barriers had no impact on 64.3% of Nova Scotia businesses with a minor positive impact for 9.1% of businesses and a major positive impact for 1.8% of businesses. Elimination of interprovincial trade barriers had unknown impacts for 21.7% of Nova Scotia businesses. Only 3.2% reported negative impacts of eliminating interprovincial trade barriers (more so in agriculture/forestry/fishing and manufacturing).
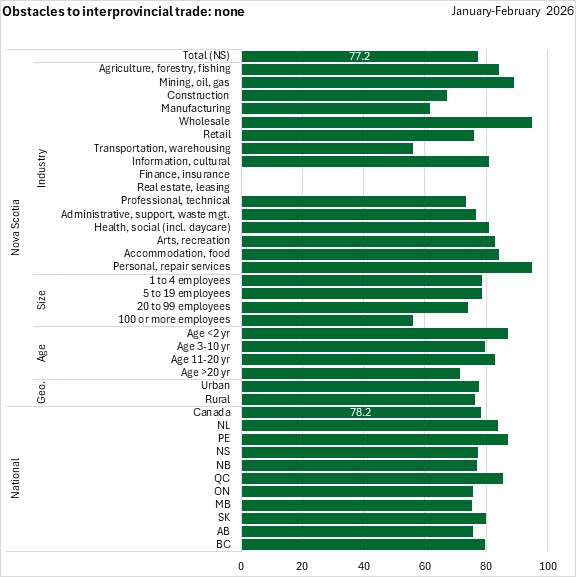
Among Nova Scotia businesses that reported participation in interprovincial trade, 77.2% reported no substantial obstacles. This was similar to the national average among firms that participated in interprovincial trade (78.2%).
Source: Statistics Canada. Table 33-10-1135-01 Future outlook over the next 12 months, first quarter of 2026; Table 33-10-1134-01 Ability for the business or organization to take on more debt, first quarter of 2026; Table 33-10-1132-01 Liquidity and access to liquidity over the next three months, first quarter of 2026; Table 33-10-1117-01 Obstacles experienced when goods or services were purchased from or sold to another province or territory over the last 12 months, first quarter of 2026; Table 33-10-1115-01 Business or organization purchased from suppliers or sold to customers in another province or territory over the last 12 months, or would consider this in the future, first quarter of 2026; Table 33-10-1112-01 Tariffs imposed by Canada on goods that the business or organization purchased from the United States over the last 12 months, first quarter of 2026; Table 33-10-1111-01 Tariffs imposed by the United States on goods that the business or organization sold to the United States over the last 12 months, first quarter of 2026; Table 33-10-1109-01 Level of impact of tariffs or trade barriers on business or organization over the last 12 months, first quarter of 2026; Table 33-10-1101-01 Most challenging obstacle expected by the business or organization over the next three months, first quarter of 2026; Table 33-10-1100-01 Business or organization obstacles over the next three months, first quarter of 2026; Table 33-10-1099-01 Business or organization expectations over the next three months, first quarter of 2026