For additional information relating to this article, please contact:
May 29, 2026HOUSING STOCK, Q1 2026 Quarter-over-quarter (Q1 2026 vs Q4 2025)
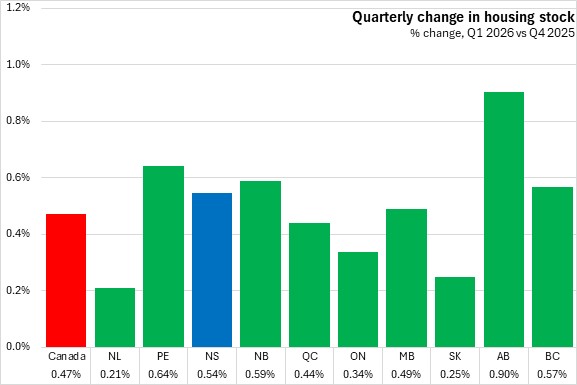
As of Q1 2026, Nova Scotia had a housing stock of 504,881 units, up 0.54% from Q4 2025. Nationally, housing stock was 17,511,702 units, up 0.47% from Q4 2025. All provinces reported a rise in housing stock, with the fastest gain in Alberta. The slowest gain was reported in Newfoundland and Labrador.
Year-over-year (Q1 2026 vs Q1 2025)
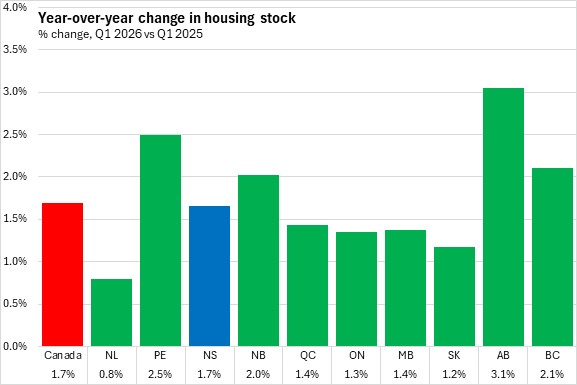
Compared with Q1 2026, Nova Scotia's housing stock has grown by 1.7%. National housing stock has also grown by 1.7% with gains in all provinces, led by Alberta. Newfoundland and Labrador lagged the other provinces in housing stock growth.
Trends
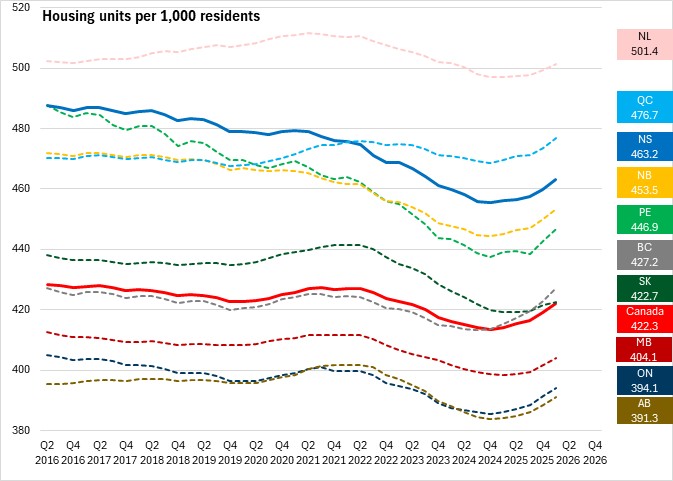
Nova Scotia's housing stock amounts to 463.2 units per 1,000 residents. Although this is the third highest among provinces (after Newfoundland and Labrador and Québec), Nova Scotia's stock of housing has grown more slowly than the population. This had resulted in falling units per 1,000 residents in the province, particularly since 2020. However, housing stock per 1,000 residents has been growing since the end of 2024.
Composition of housing stock
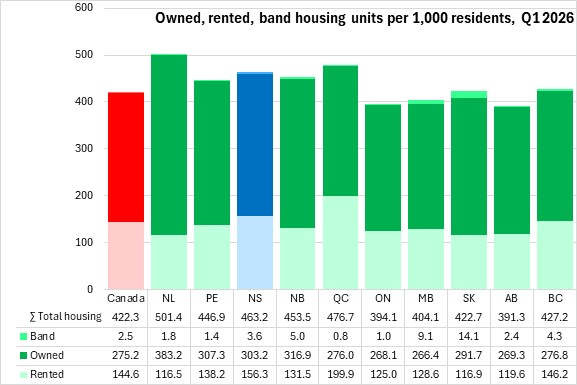
Nova Scotia's housing stock includes 303.2 units per 1,000 residents of owned stock, 156.3 units per 1,000 residents of rented stock and 3.6 units per 1,000 residents in band housing stock.
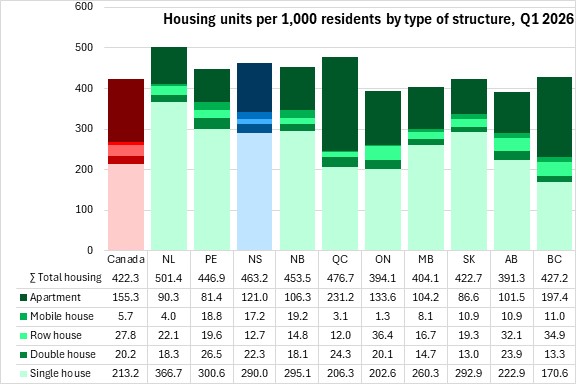
Compared with national averages, Nova Scotia's housing stock consists more of single houses (290.0 units per 1,000 residents) and less of apartments (121.0 units per 1,000 residents). Nova Scotia also has more mobile homes per 1,000 residents than the national average, though this is only 3.7% of the province's housing stock. Newfoundland and Labrador reported the highest stock of single houses per 1,000 residents while Québec reported the highest stock of apartments per 1,000 residents.
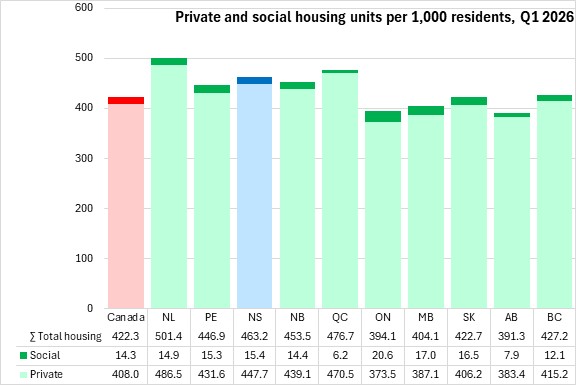
Privately-held housing amounted to 96.7% of Nova Scotia's housing stock (96.6% nationally). Nova Scotia reported more units of social housing stock per 1,000 residents than the national average.
Note: Data for private dwellings occupied by usual and non-usual residents are not available.
Source: Statistics Canada. Table 36-10-0688-01 Housing stock in unit by institutional sector, housing type, dwelling occupation, dwelling type, and tenure type; Table 17-10-0009-01 Population estimates, quarterly