For additional information relating to this article, please contact:
July 07, 2026CANADA TRADE BALANCE, MAY 2026 Month-over-month (May 2026 vs April 2026)
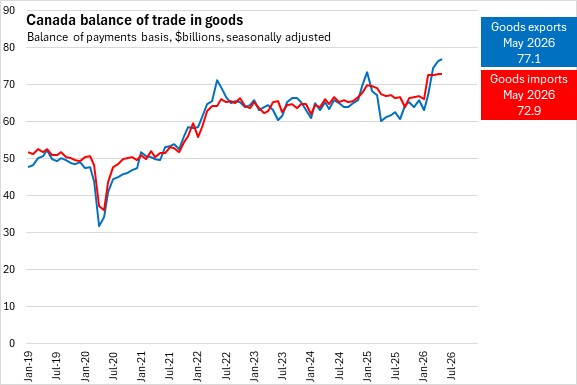
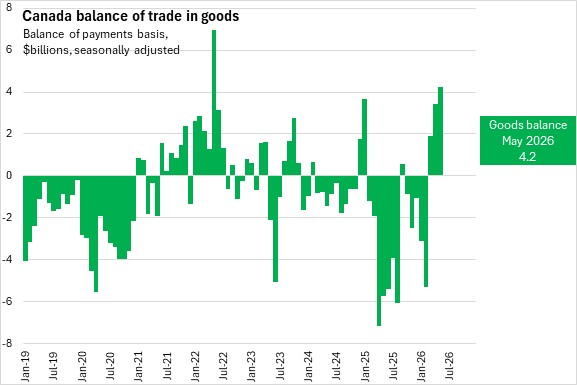
In May 2026, Canada's international exports of goods rose 0.9% to $77.1 billion. Canada’s goods imports were down 0.2% to $72.9 billion. Canada's goods trade surplus widened by $0.84 billion to $4.2 billion in May 2026.
Exports rose in seven of eleven product sections, led by higher exports of metal ores and non-metallic minerals. Exports also rose in metal and non-metallic mineral products, consumer goods, basic and industrial chemical/plastic/rubber products, and farm/fishing/intermediate food products. Exports of energy products were down in May due to lower volumes. Statistics Canada notes that in periods of high price volatility, estimates of energy product exports are subject to larger revisions.
Imports declined despite increases nine of eleven product sections. Lower imports were due to declines in metal and non-metallic mineral products (primarily gold) and basic/semi-finished iron or steel products.
In real (or volume) terms, exports were essentially unchanged while imports were up 0.4%.
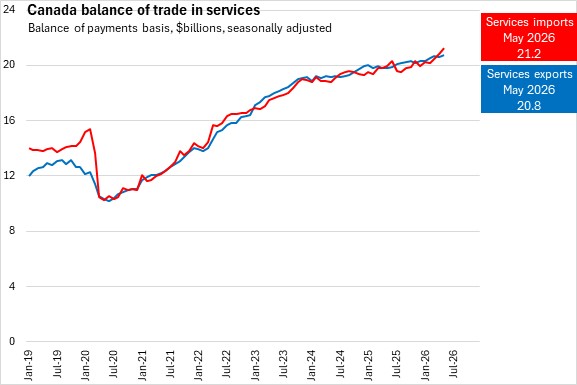
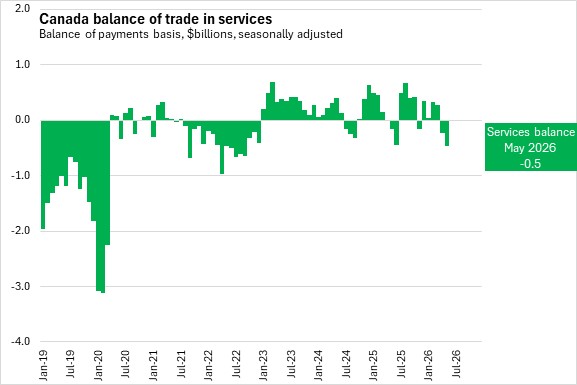
Canada's international exports of services rose 0.9% from the previous month to $20.8 billion in May 2026. Canada's imports of services rose 2.0% to $21.2 billion. Canada's services trade deficit widened by $232 million to $464 million in May.
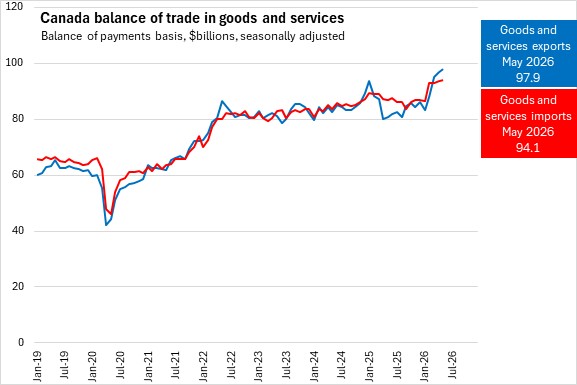
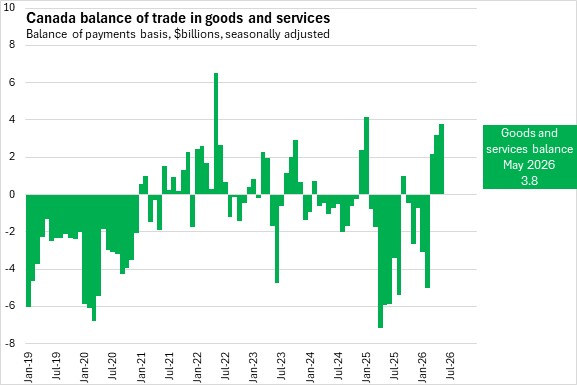
Canada’s international exports of goods and services rose 0.9% to $97.9 billion in May 2026. Canada's international imports of goods and services rose 0.3% to $94.1 billion. Canada's overall international trade surplus widened by $607 million to $3.8 billion in May 2026.
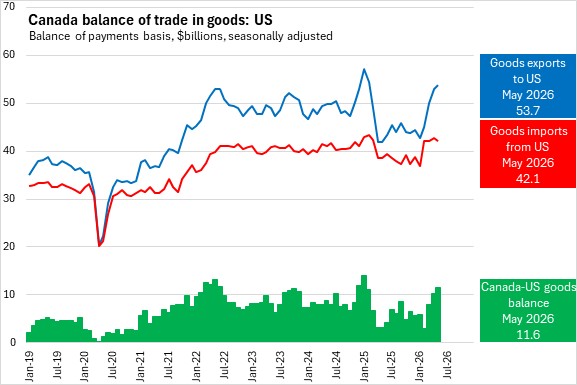
Exports of goods to the United States from Canada rose 1.5% to $53.7 billion in May 2026 while imports of goods from the US fell 1.4% to $42.1 billion. Canada's trade surplus in goods with the US widened by $1.4 billion to $11.6 billion in May 2026.
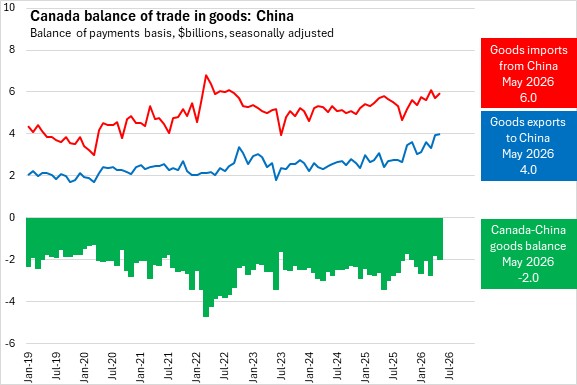
Canada's exports of goods to China rose 1.0% to $4.0 billion in May 2026. Canada's imports of goods from China rose 4.4% to $6.0 billion. Canada's deficit in goods trade with China widened by $213 million to $2.0 billion.
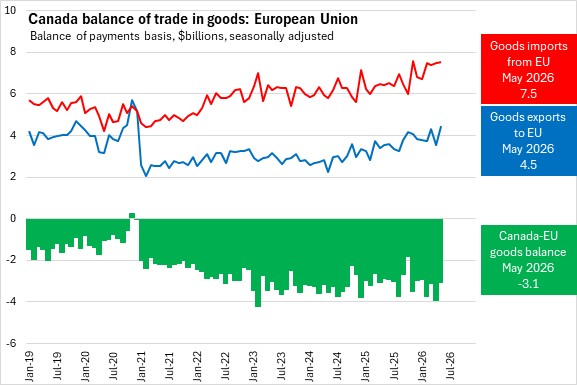
In May 2026, Canada's exports of goods to the European Union rose 25.5% to $4.5 billion. Canada's imports of goods from the EU rose 0.9% to $7.5 billion. Canada's deficit in goods trade with the EU narrowed by $836 million to $3.1 billion.
Year-over-year (May 2026 vs May 2025)
Compared with the same month in 2025:
- Canada's international exports of goods rose 26.0% (+$15.9 billion) while Canada’s goods imports rose 8.8% (+$5.9 billion). Canada's goods trade position improved by $10.0 billion, from a deficit of $5.7 billion in May 2025 to a surplus of $4.2 billion in May 2026.
- Canada's international exports of services were up 5.1% (+$1.0 billion) while Canada's imports of services were up 6.5% (+$1.3 billion). Canada's services trade deficit widened by $297 million.
- Canada’s combined international exports of goods and services rose by 20.9% (+$16.9 billion) while imports of goods and services rose by 8.3% (+$7.2 billion). Canada's overall international trade position improved by $9.7 billion, from a deficit of $5.9 billion in May 2025 to a surplus of $3.8 billion in May 2026.
- Exports of goods from Canada to the United States increased 28.2% (+$11.8 billion) while imports of goods from the US rose 8.9% (+$3.4 billion). Canada's trade surplus in goods with the US widened by $8.4 billion.
- Canada's exports of goods to China rose 63.2% (+$1.5 billion). Canada's imports of goods from China rose 2.3% (+$135 million). Canada's deficit in goods trade with China narrowed by $1.4 billion.
- Canada's exports of goods to the European Union rose 25.1% (+$894 million). Canada's imports of goods from the EU rose 17.2% (+$1.1 billion). Canada's deficit in goods trade with the EU widened by $212 million.
Source: Statistics Canada, Table 12-10-0011-01 International merchandise trade for all countries and by Principal Trading Partners, monthly (x 1,000,000); Table 12-10-0121-01 International merchandise trade by commodity, monthly (x 1,000,000); Table 12-10-0144-01 International trade in services, monthly (x 1,000,000)