For additional information relating to this article, please contact:
July 10, 2026LABOUR MARKET TRENDS, JUNE 2026 June labour force survey results reflect the period from June 14 to 20, 2026.
Ages 15+ (June 2026 vs May 2026, seasonally adjusted)
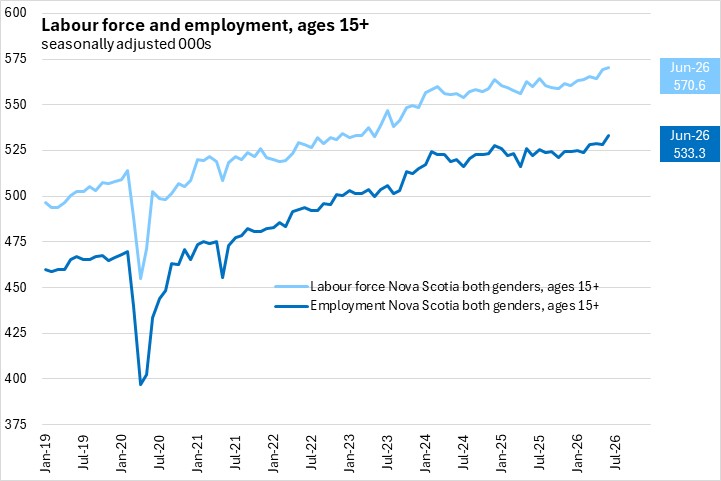
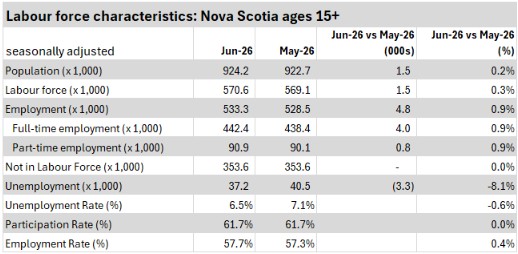
Nova Scotia's seasonally adjusted employment increased by 4,800 (+0.9%) to 533,300 in June. This follows a decrease of 0.04% (-200) in May .
The change in employment reflected an increase in full-time (+4,000) and part-time employment (+800). Note that changes in full-time and part-time employment can also reflect changing hours for the same job.
Nova Scotia’s labour force rose by 1,500 (+0.3%) to 570,600 in June 2026.
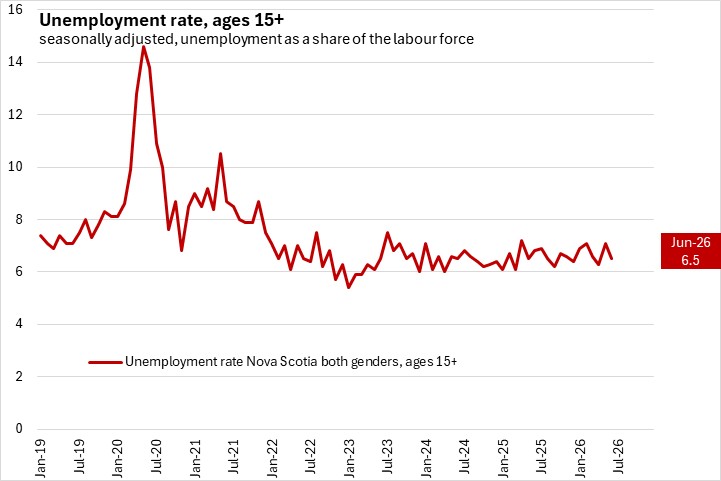
With employment rising faster than labour force, Nova Scotia's unemployment rate fell 0.6 percentage points to 6.5% in June 2026.
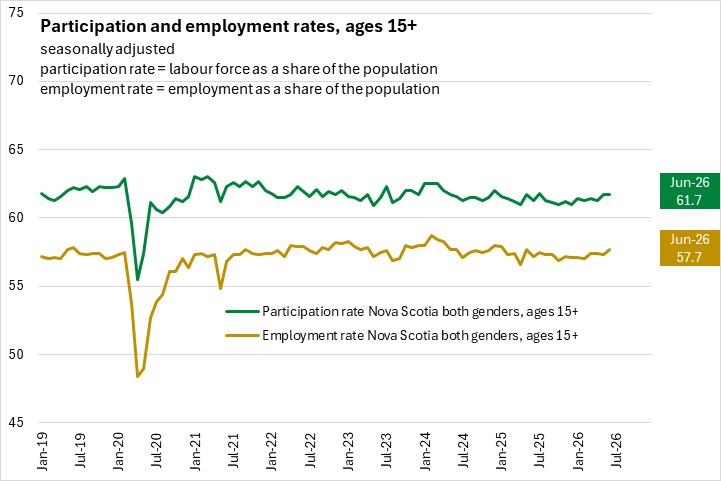
Nova Scotia's participation rate was unchanged at 61.7%, while the employment rate increased 0.4 percentage points to 57.7%
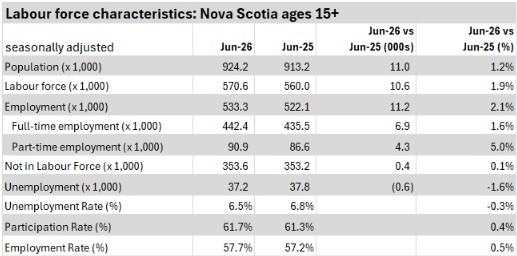
Ages 15+ (June 2026 vs June 2025, seasonally adjusted)
Compared with June 2025, Nova Scotia's population over the age of 15 increased by 11,000 (+1.2%), while the labour force rose by 10,600 (+1.9%), and employment rose by 11,200 (+2.1%). Compared to June 2025, the unemployment rate was down 0.3 percentage points, while the participation rate was up 0.4 percentage points, and the employment rate increased by 0.5 percentage points.
Ages 15+ (January-June 2026 vs January-June 2025, seasonally adjusted)
Compared with January-June 2025, Nova Scotia's population over the age of 15 increased by 9,500 (+1.0%), while the labour force rose by 6,700 (+1.2%), and employment rose by 5,100 (+1.0%). Compared to January-June 2025, the unemployment rate was up by 0.2 percentage points, while the participation rate was up 0.1 percentage points, and the employment rate was down 0.03 percentage points.
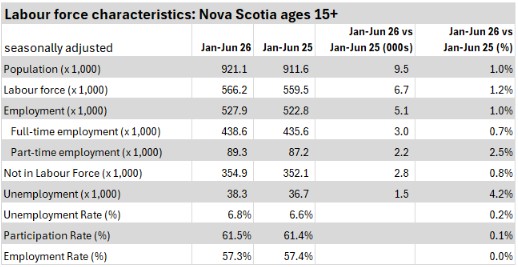
Note: Year-to-date estimates are calculated as averages of monthly data and rounded to the nearest tenth. Year-to-date changes in the table are also rounded to the nearest tenth.
Age Cohorts (June 2026 vs May 2026, seasonally adjusted)
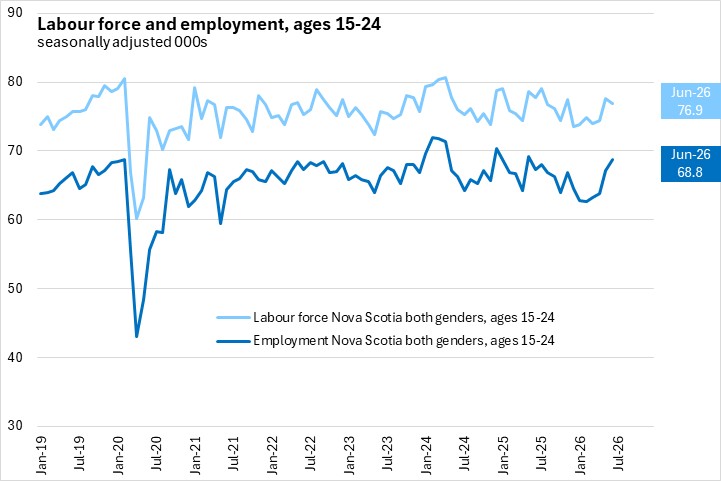
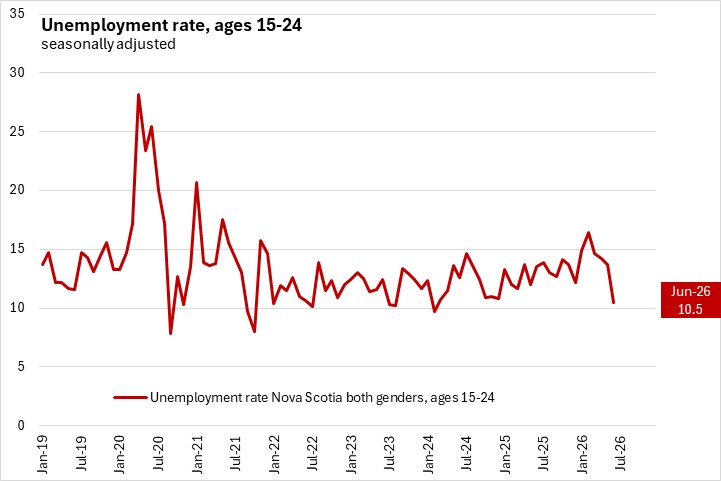
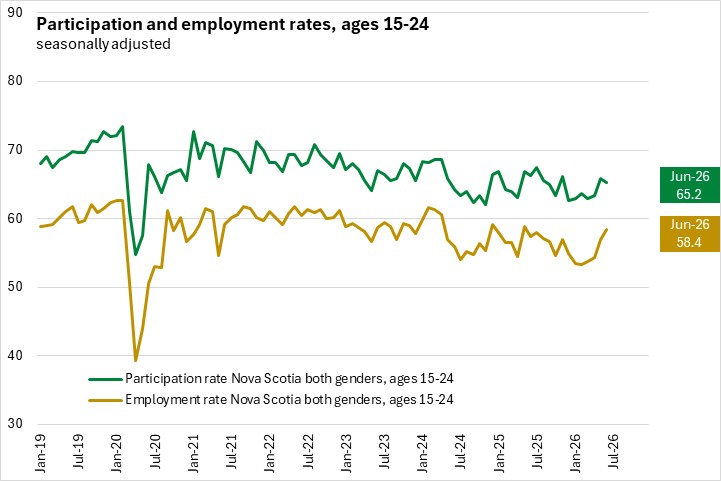
Among youth (ages 15-24), employment increased by 1,700 (+2.5%), while the labour force declined by 700 (-0.9%). The youth unemployment rate fell 3.2 percentage points to 10.5% in June 2026. The youth participation rate fell 0.7 percentage points to 65.2% while the youth employment rate rose 1.4 percentage points to 58.4%.
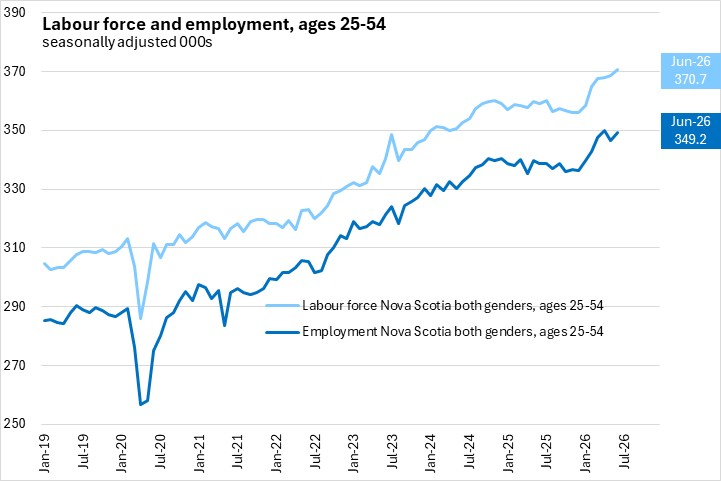
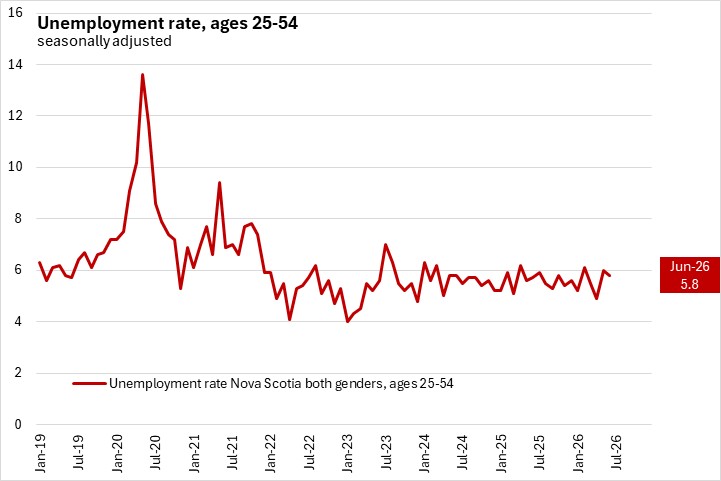
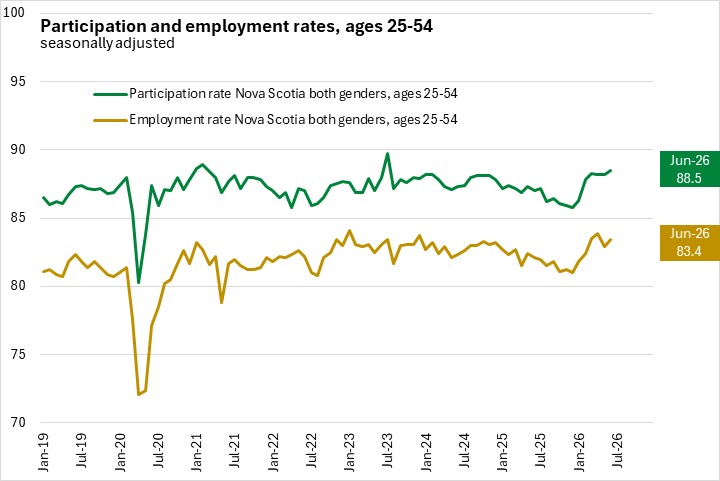
The population aged 25-54 makes up the largest part of the labour force. In the core age group, employment rose 2,600 (+0.8%) while the labour force increased by 1,900 (+0.5%). With employment rising faster than labour force, the core aged unemployment rate fell 0.2 percentage points to 5.8% in June 2026. The core aged participation rate rose 0.3 percentage points to 88.5%, while the core aged employment rate rose 0.5 percentage point to 83.4%.
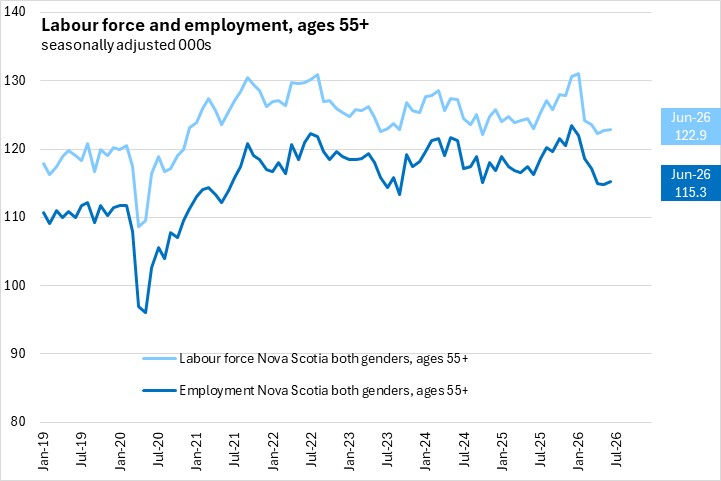
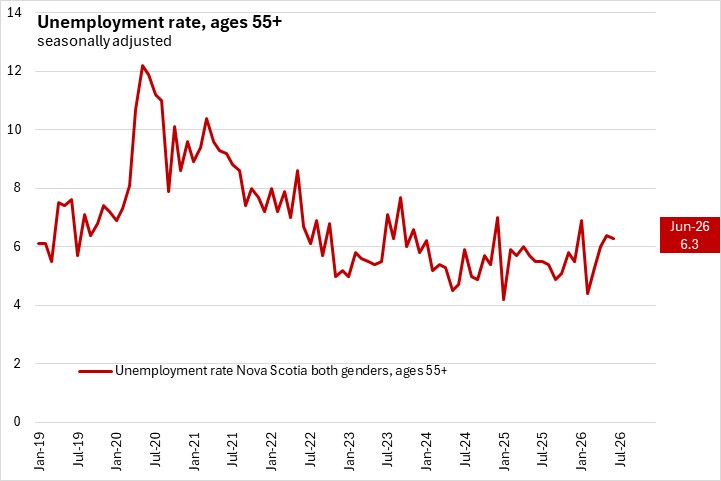
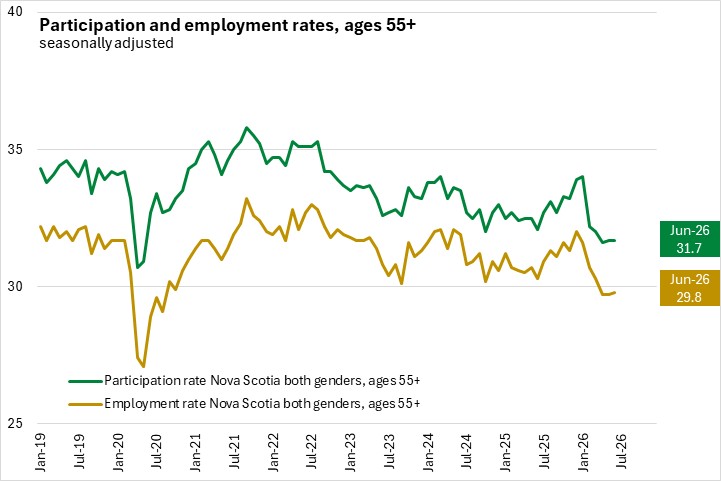
Among older workers (aged 55+) the labour force rose by 200 (+0.2%) while employment rose by 500 (+0.4%). With employment rising faster than labour force, the older worker unemployment rate fell 0.1 percentage points to 6.3%. The older worker participation rate was unchanged at 31.7% and the employment rate was up 0.1 percentage points to 29.8%.
Males and Females (Ages 15+, June 2026 vs May 2026, seasonally adjusted)
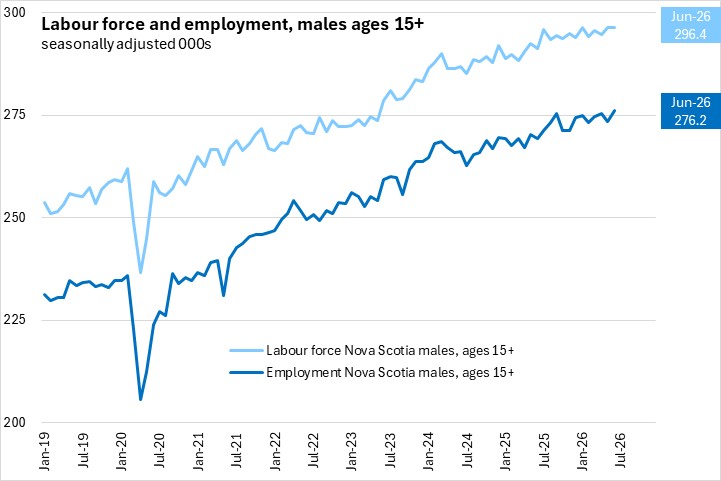
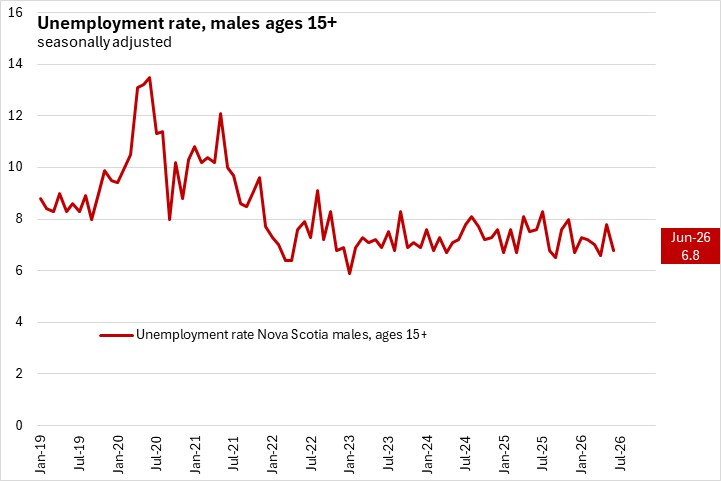
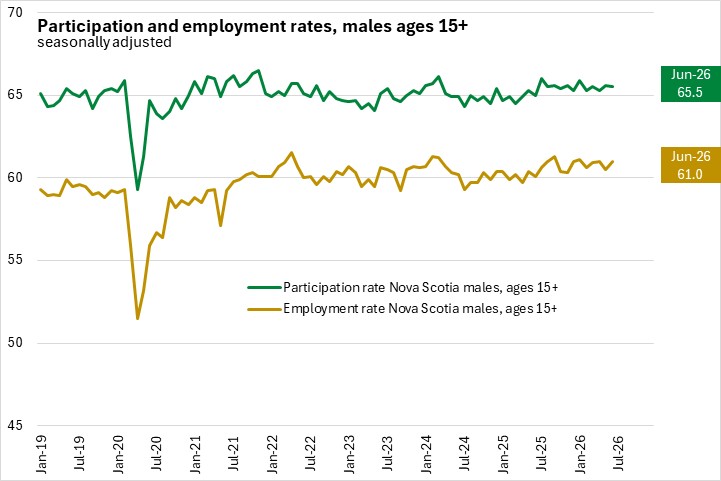
Monthly employment rose by 2,800 (+1.0%) for males while the labour force fell by 100 (-0.03%) from May. With employment rising and labour force falling, the male unemployment rate fell 1.0 percentage points to 6.8% in June. The male participation rate fell 0.1 percentage points to 65.5%, while the male employment rate rose 0.5 percentage points to 61.0%.
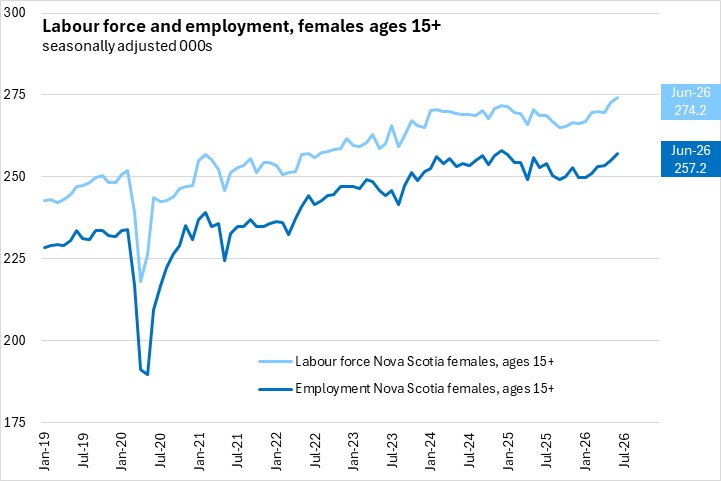
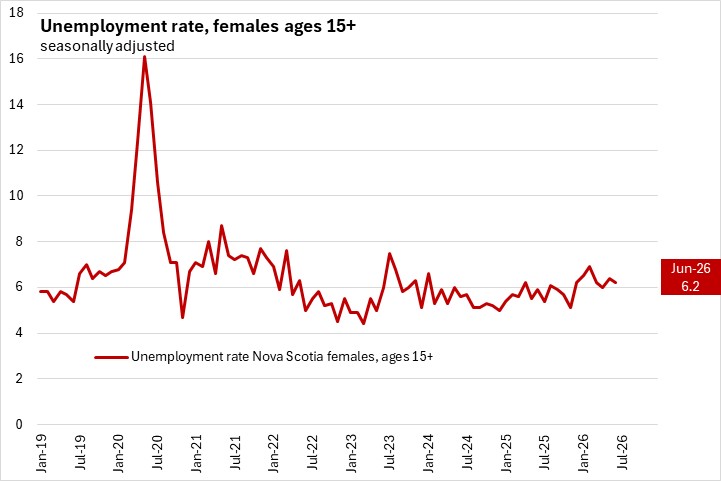
Females reported a labour force increase of 1,600 (+0.6%) and an employment increase of 2,100 (+0.8%). With employment growing faster than labour force, the female unemployment rate fell by 0.2 percentage points to 6.2% in June. The female participation rate increased 0.3 percentage points to 58.2% while the employment rate increased 0.4 percentage points to 54.6%.
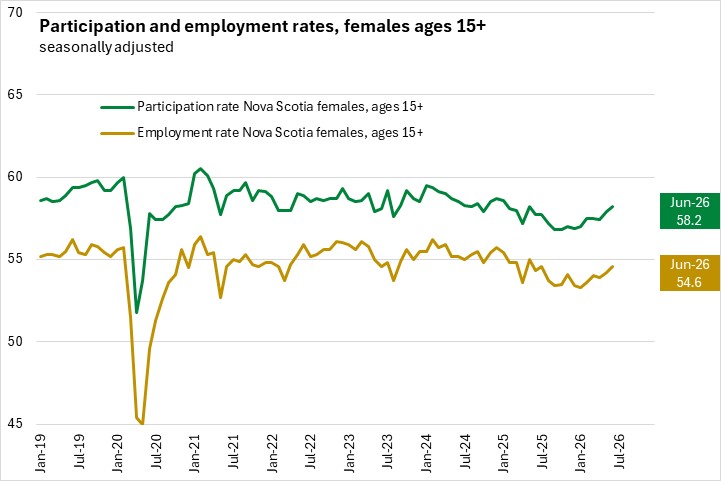
Employment increases in June were broad-based, with the largest increase among males and core-aged workers. Labour force gains were strongest for core-aged workers and females, with smaller gains among older workers. Employment and labour force gains outpacing population growth resulted in fewer persons not in the labour force among core-aged workers and females. Unemployment declined month-over-month across all age and sex cohorts, with the largest declines among males and youth.
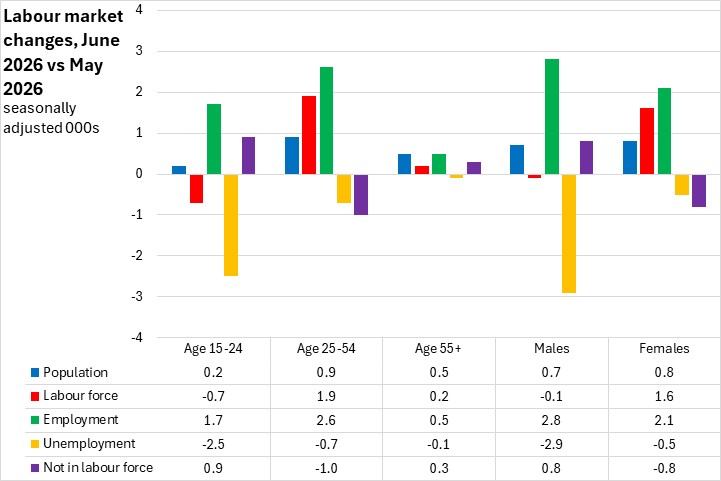
Age and gender cohorts (June 2026 vs June 2025, seasonally adjusted)
Compared with June 2025, there were employment gains across all age and sex cohorts except older workers. Employment gains were highest among core-aged workers and males. Labour force growth was reported for those aged 25-54 and both males and females, partially offset by a decline among younger and older workers compared to one year ago. Unemployment increases were concentrated among core-aged and older workers, as well as females. Population growth among older workers primarily translated into more persons not in the labour force.
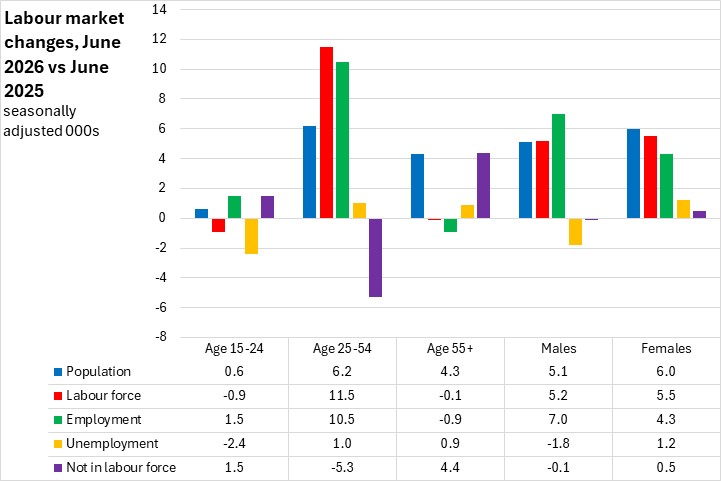
Age and gender cohorts (January-June 2026 vs January-June 2025, seasonally adjusted)
In the first six months of 2026, labour force and employment gains were concentrated among core-aged workers and males. Population growth among females outpacing growth in the labour force resulted in a larger number of persons not in the labour force, along with lower employment and higher unemployment. Males reported labour force growth that outpaced population growth, resulting in slightly less unemployment and fewer persons not in the labour force. Unemployment increases were concentrated among those aged 15-24 and females.
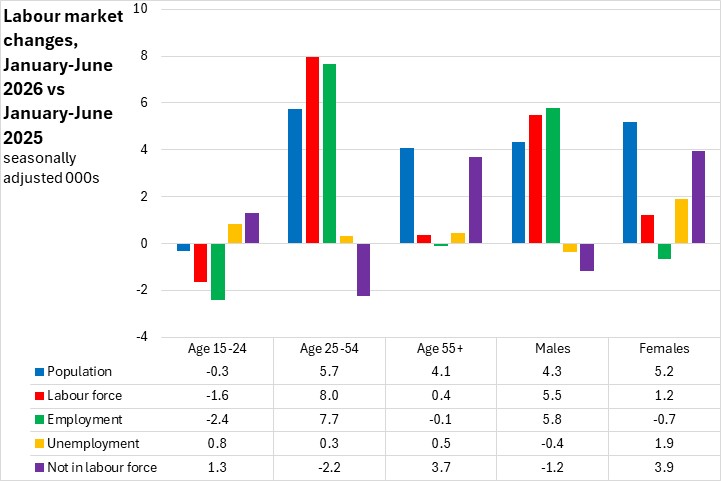
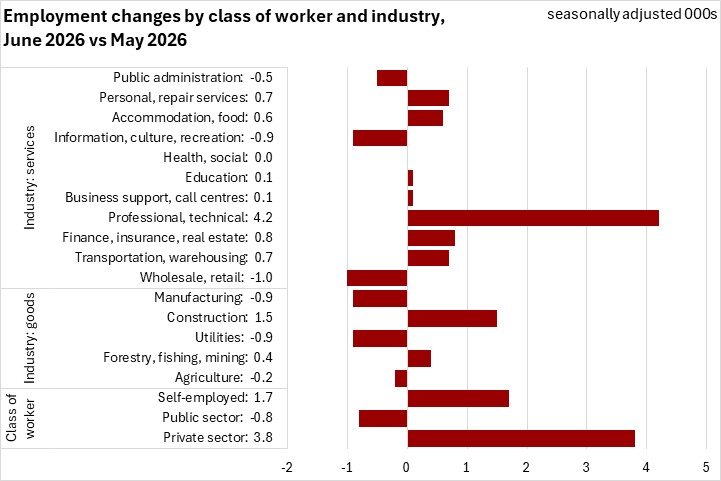
Class of Worker and Industry (June 2026 vs May 2026, seasonally adjusted)
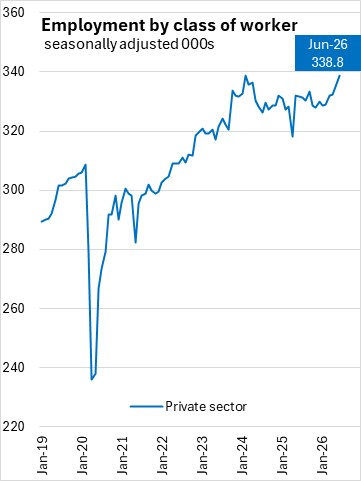
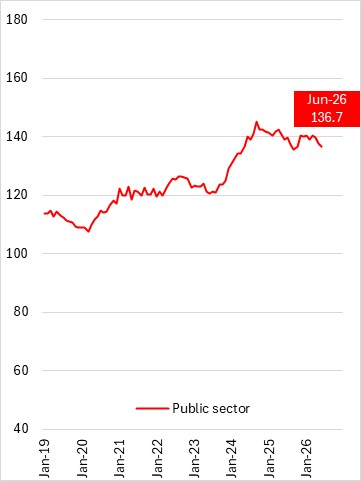
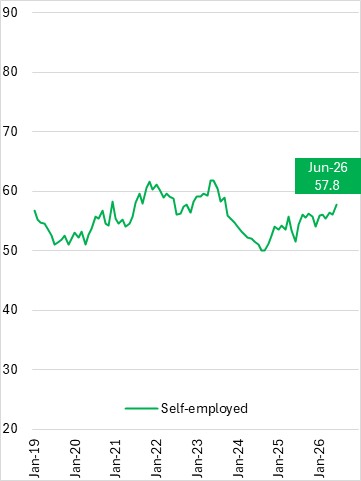
Employment increase in June was due to higher private (+3,800, +1.1%) and self-employment (+1,700, +3.0%), partially offset by a decrease in public sector employment (-800, 0.6%).
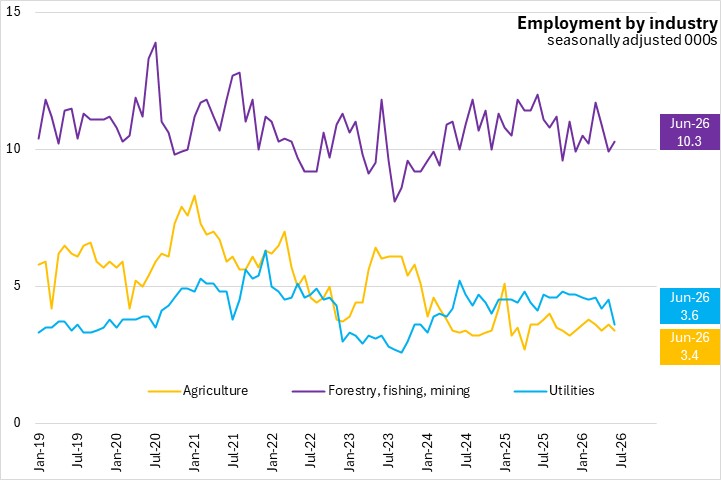
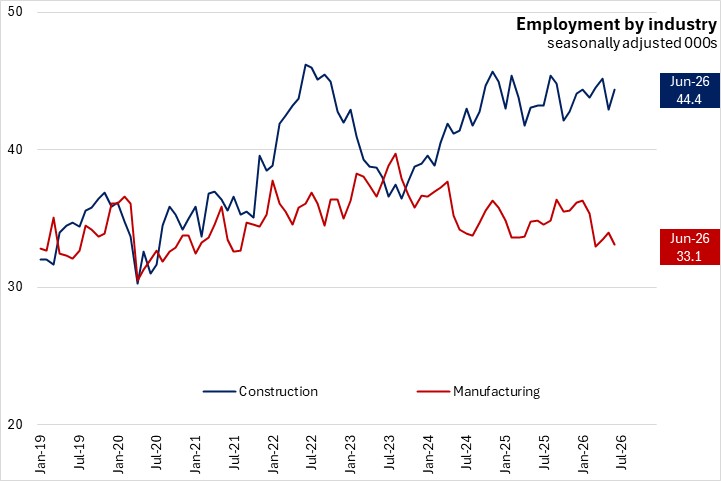
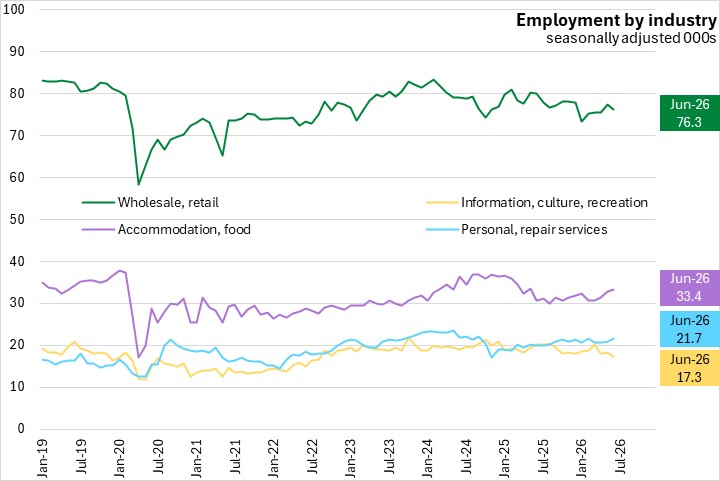
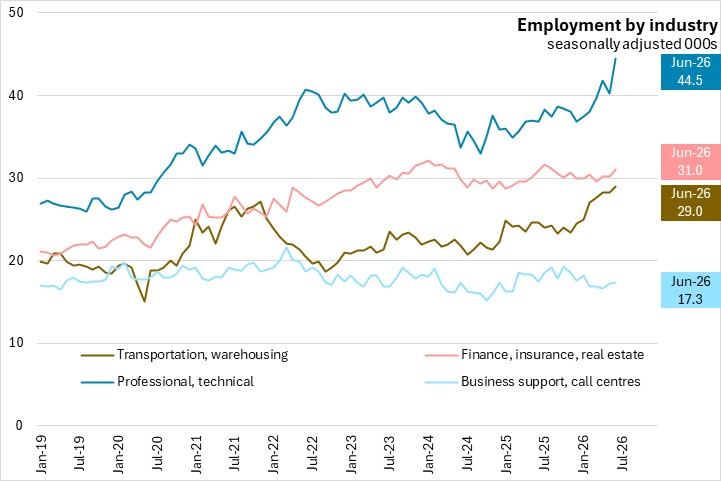
Classified by industry, the largest declines were in wholesale/retail, manufacturing, utilities, and information/culture/recreation. The largest increases were in professional/technical services and construction.
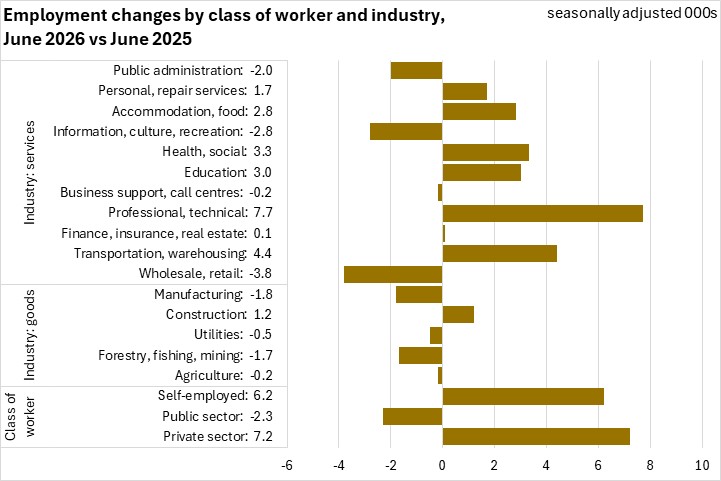
Class of Worker and Industry (June 2026 vs June 2025, seasonally adjusted)
Compared to June 2025, employment increased for private sector workers (+7,200, +2.2%), and self-employment (+6,200, +12.0%), partially offset by lower public sector employment (-2,300, -1.7%).
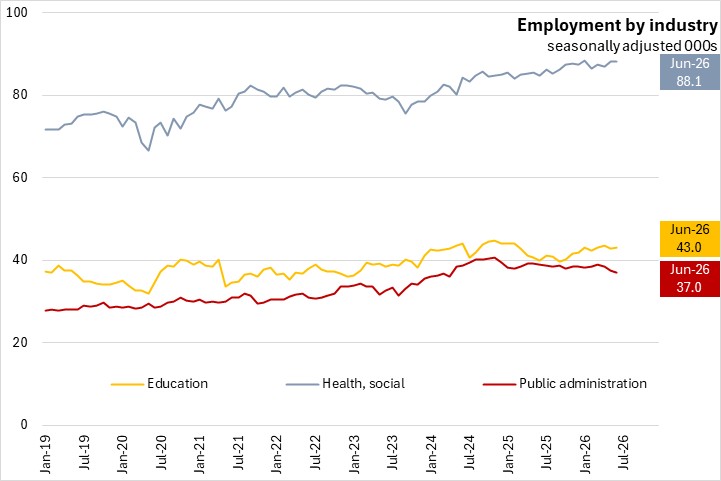
Employment increased the most in professional/technical services, transportation/warehousing, and health care/social assistance. Employment fell the most in wholesale/retail trade and information/culture/recreation.
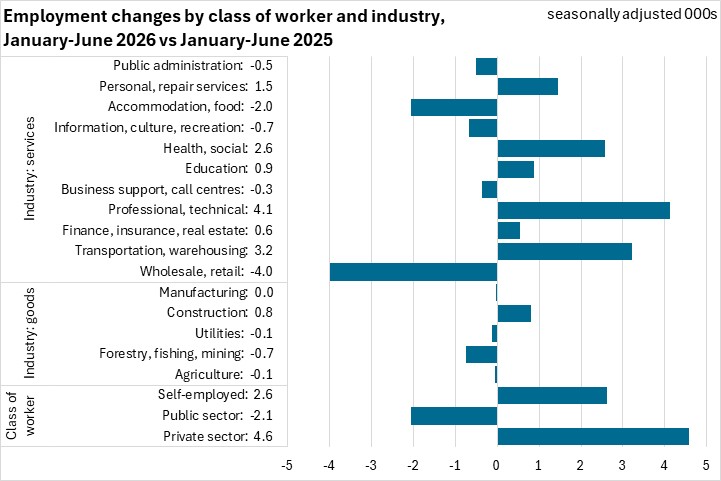
Class of Worker and Industry (January-June 2026 vs January-June 2025, seasonally adjusted)
Compared to January-June 2025, employment increased for private sector (+4,600, +1.4%) and self-employment (+2,600, +4.9%), partially offset by a decline in public sector employment (-2,100, -1.5%).
Over the last 12 months, employment increased the most in professional/technical services, transportation/warehousing, and health care/social assistance. Employment fell the most in wholesale/retail trade and accommodation/food services.
Hours worked and employment (June 2026, unadjusted)
Compared to the provincial average, a larger share of workers in goods producing industries, as well as transportation/warehousing, business support/call centres and personal/repair services worked more than 40 hours per week in June 2026.
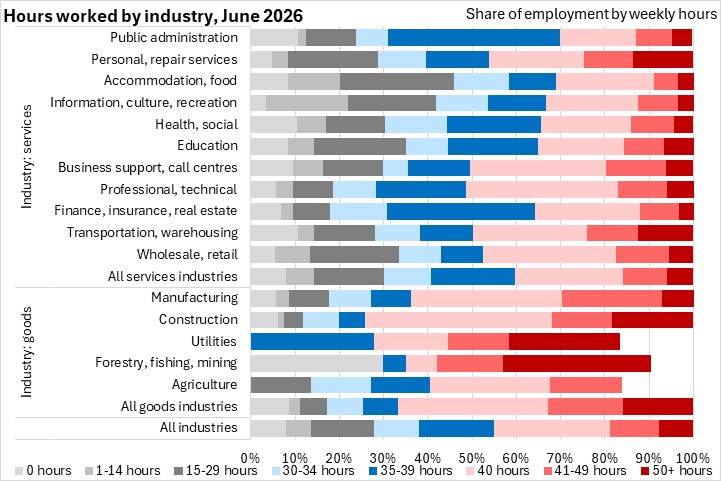
Note that some data on those working few hours or more than 40 hours in utilities, forestry/fishing/mining and agriculture were suppressed.
Average weekly earnings (unadjusted, both full time and part time, June 2026 vs June 2025)
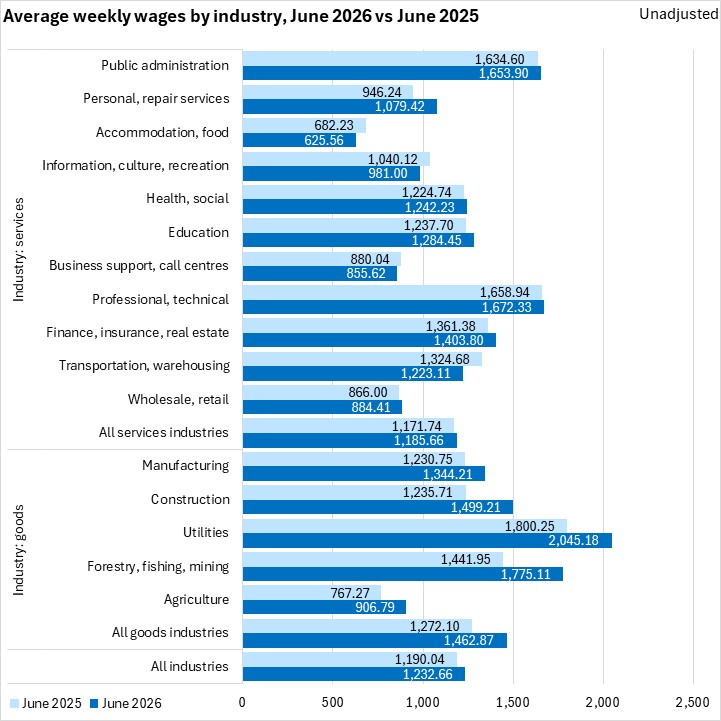
Average weekly earnings increased by 3.6% from June 2025 to June 2026. The fastest gains in average weekly earnings were in forestry/fishing/mining, construction, and agriculture. Declines in average weekly wages were fastest in accommodation/food services, transportation/warehousing, and information/culture/recreation.
The increase in Nova Scotia's all items consumer price index was 5.2% from May 2025 to May 2026.
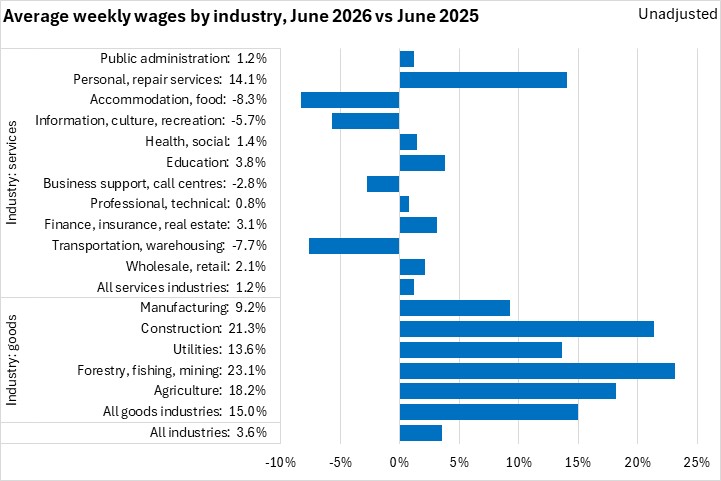
Average weekly earnings across all employees were $1,232.66 in June 2026. The highest average weekly earnings (both full and part time employees) were reported in utilities, forestry/fishing/mining, and professional/technical services. The lowest average weekly earnings were in accommodation/food services, business support/call centres, and wholesale/retail trade.
Average weekly earnings (unadjusted, both full time and part time, January-June 2026 vs January-June 2025)
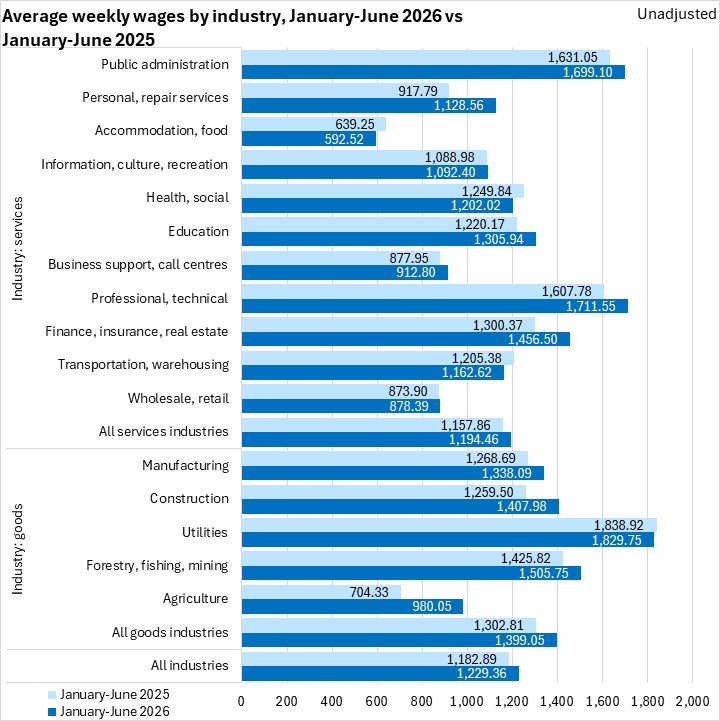
Average weekly earnings increased by 3.9% in the first six months of 2026. The fastest gains in average weekly earnings were in agriculture and personal/repair services, followed by finance/insurance/real estate and construction. Declines in average weekly wages were steepest in accommodation/food services.
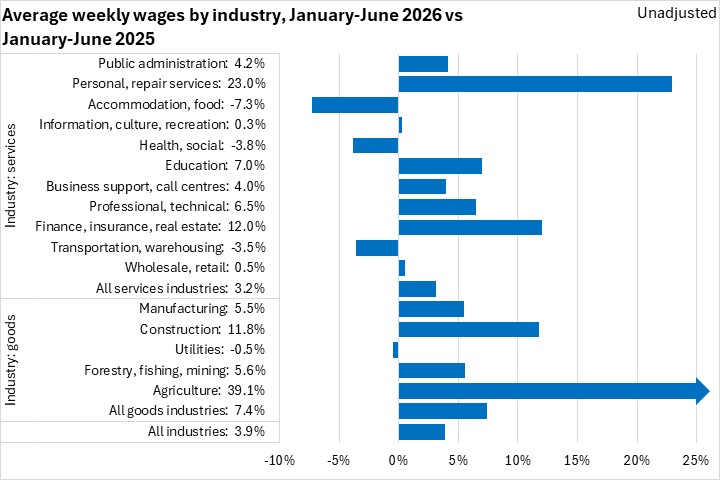
Average weekly earnings across all employees were $1,229.36 in January-June 2026. The highest average weekly earnings (both full and part time employees) were reported in utilities, professional/technical services, and public administration. The lowest average weekly earnings were in accommodation/food services, wholesale/retail trade, and business support/call centres.
Regions (June 2026 vs June 2025, unadjusted 3 month moving average)
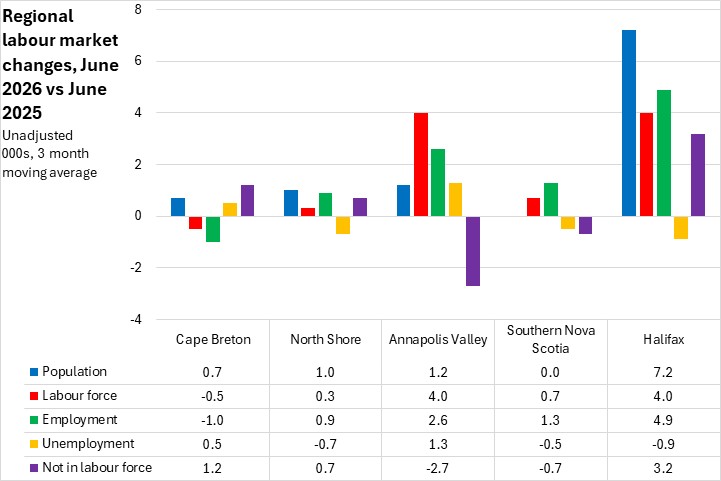
Compared with June 2025, there was population growth in every region except Southern Nova Scotia (which reported no change in population), with the largest growth in Halifax. Cape Breton reported a decline in the labour force and employment compared to one year ago, translating directly into more persons not in the labour force and unemployment. In the North Shore region, employment gains outpacing growth in the labour force resulted in fewer unemployed. The Annapolis Valley region reported growth in the labour force that outpaced population and employment growth, resulting in an increase in unemployment and fewer persons not in the labour force. Southern Nova Scotia reported employment growth outpacing growth in the labour force, drawing on persons not in the labour force and reducing unemployment. Halifax's labour force growth was outpaced by employment gains and population growth, resulting in more persons not in the labour force.
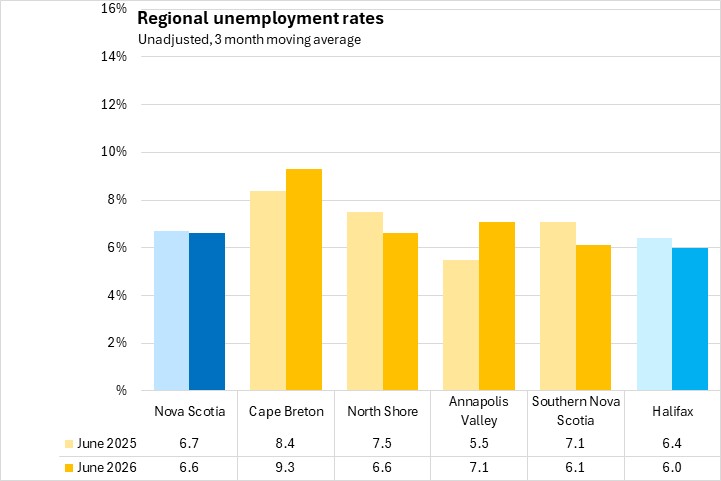
Unemployment rates rose in Cape Breton and Annapolis Valley, while they declined in Halifax and the North Shore and Southern regions compared to June 2025.
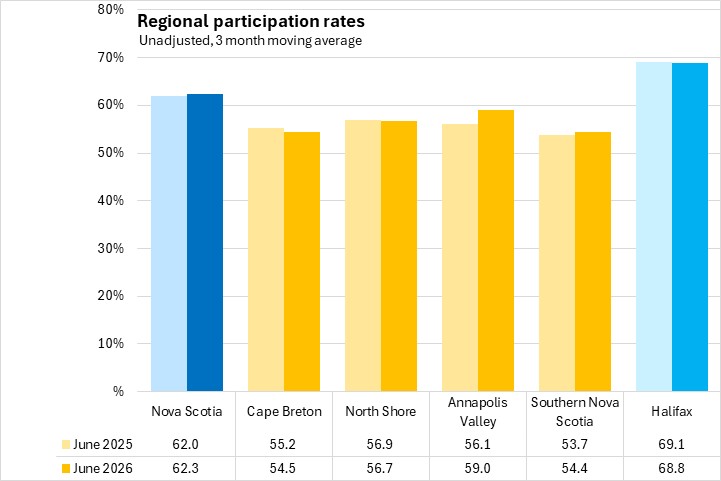
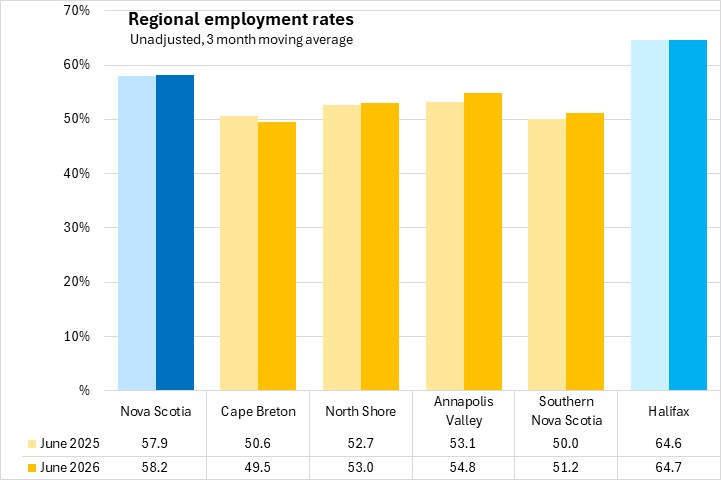
Participation rates rose in Annapolis Valley and Southern Nova Scotia, while they declined in Cape Breton, Halifax and the North Shore. Employment rates rose in all regions except Cape Breton.
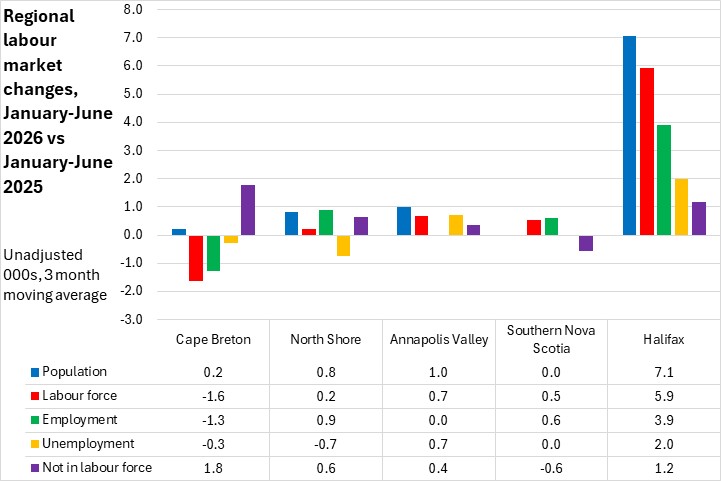
Regions (January-June 2026 vs January-June 2025, unadjusted 3 month moving average)
Compared with January-June 2025, population growth was primarily in Halifax, with smaller gains reported in Annapolis Valley, North Shore and Cape Breton regions. Cape Breton reported labour force decline outpacing employment decline, resulting in fewer unemployed and a rise in those not in the labour force. The North Shore region reported employment gains that outpaced labour force in the first six months of the year, reducing the number of unemployed. Employment was unchanged in the Annapolis Valley with an increase in the labour force and population, resulting in more persons unemployed and not in the labour force. Southern Nova Scotia reported no population growth, with growth in the labour force outpaced by increasing employment, resulting in fewer persons not in the labour force. Labour force gains outpaced employment in Halifax, resulting in more unemployed and those not in the labour force.
Provincial Comparisons (seasonally adjusted)
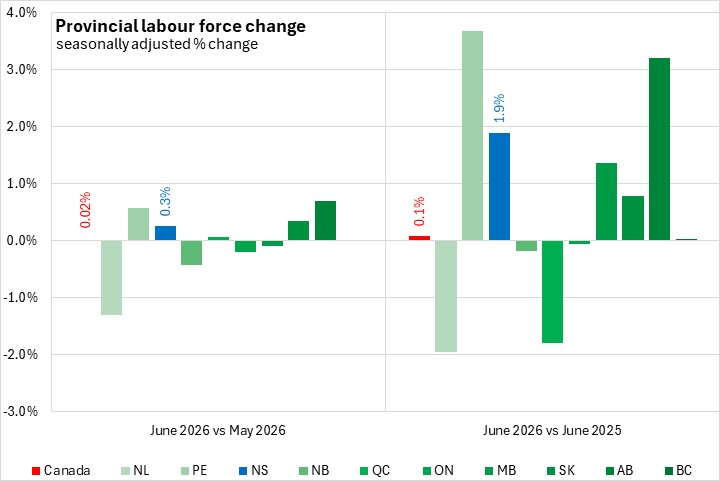
Canada's labour force rose 0.02% from May to June, with growth in six provinces. The fastest decline was in Newfoundland and Labrador, while the fastest increase was in Alberta.
Compared with June 2025, the national labour force was up 0.1%, with six provinces reporting growth. Prince Edward Island reported the fastest increase compared to one year ago, while the fastest decline was in Newfoundland and Labrador.
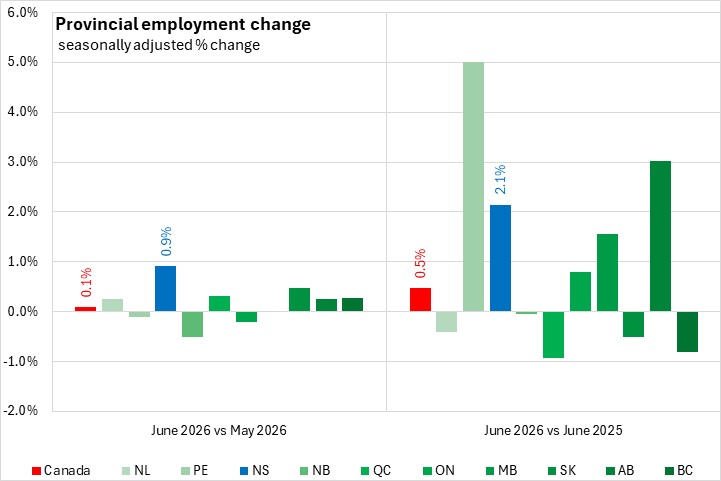
Canada's employment was up 0.1% in June 2026, with seven provinces reporting increases led by Nova Scotia. The fastest decline was in New Brunswick.
Compared with June 2025, the national employment gain was 0.5% with five provinces reporting growth. The fastest growth was in Prince Edward Island. Québec reported the fastest decline compared to one year ago.
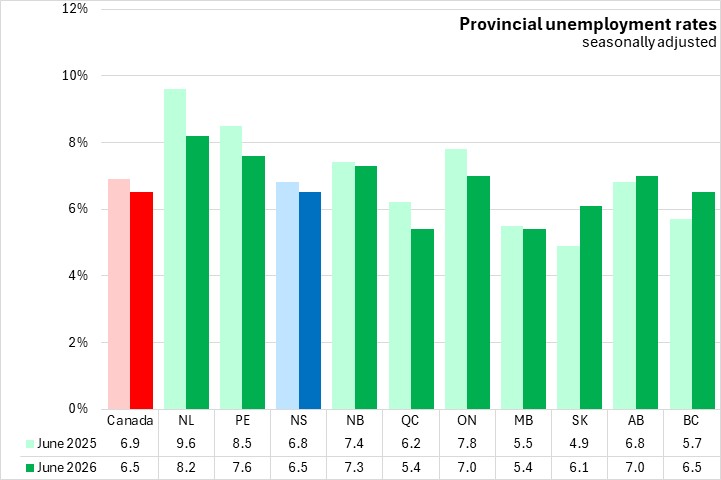
The national unemployment rate was 6.5% in June 2026, down from 6.9% in June 2025. Manitoba and Québec had the lowest unemployment rate while Newfoundland and Labrador reported the highest unemployment rate in June 2026.
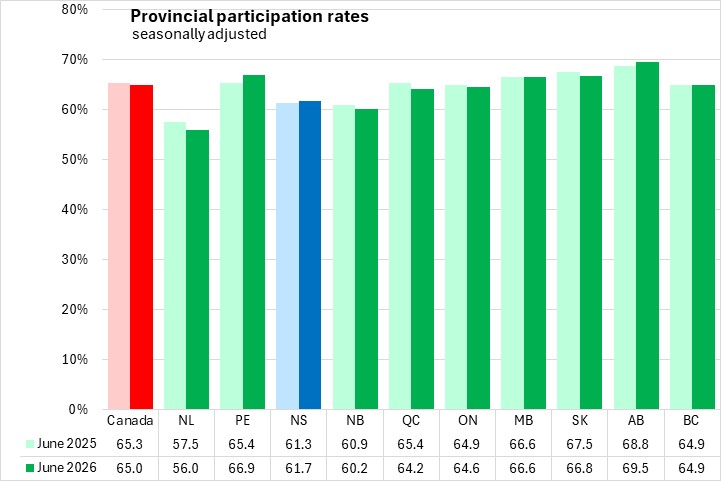
The national participation rate was 65.0% in June 2026. The highest participation rate was in Alberta while the lowest was in Newfoundland and Labrador.
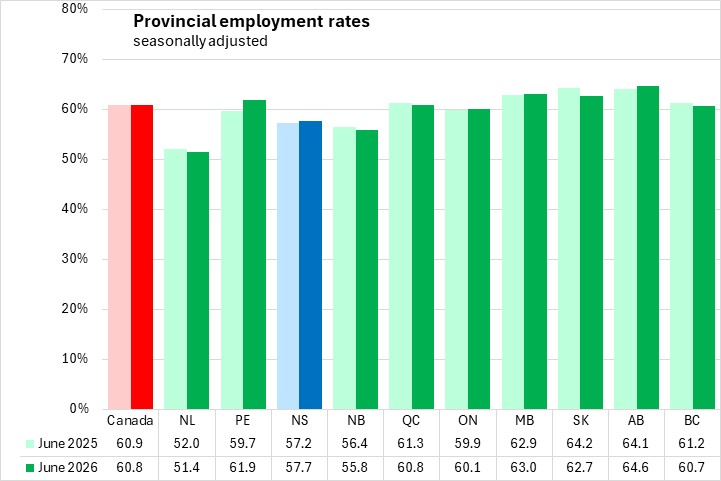
The national employment rate was 60.8% in June 2026. Alberta reported the highest employment rate while Newfoundland and Labrador reported the lowest.
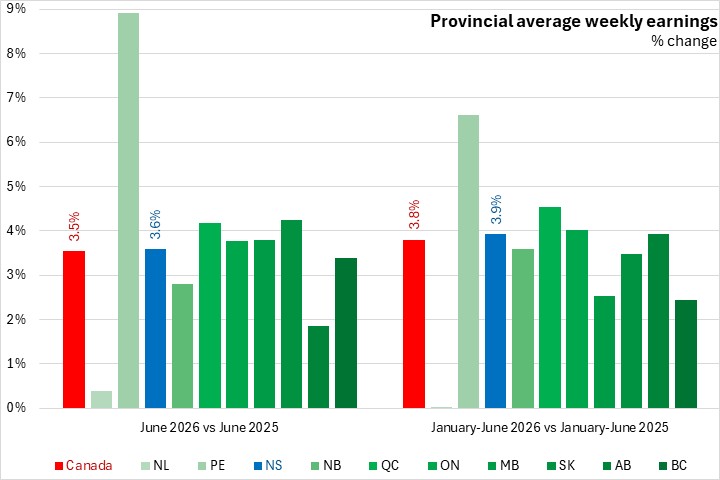
In unadjusted results, Nova Scotia's average weekly earnings grew by 3.6% year-over-year. National average weekly earnings were up 3.5% with gains in all provinces.
In the first six months of 2026, Nova Scotia's average weekly earnings grew by 3.9%. National average weekly earnings were up 3.8% in January-June 2026, with all provinces reporting growth.
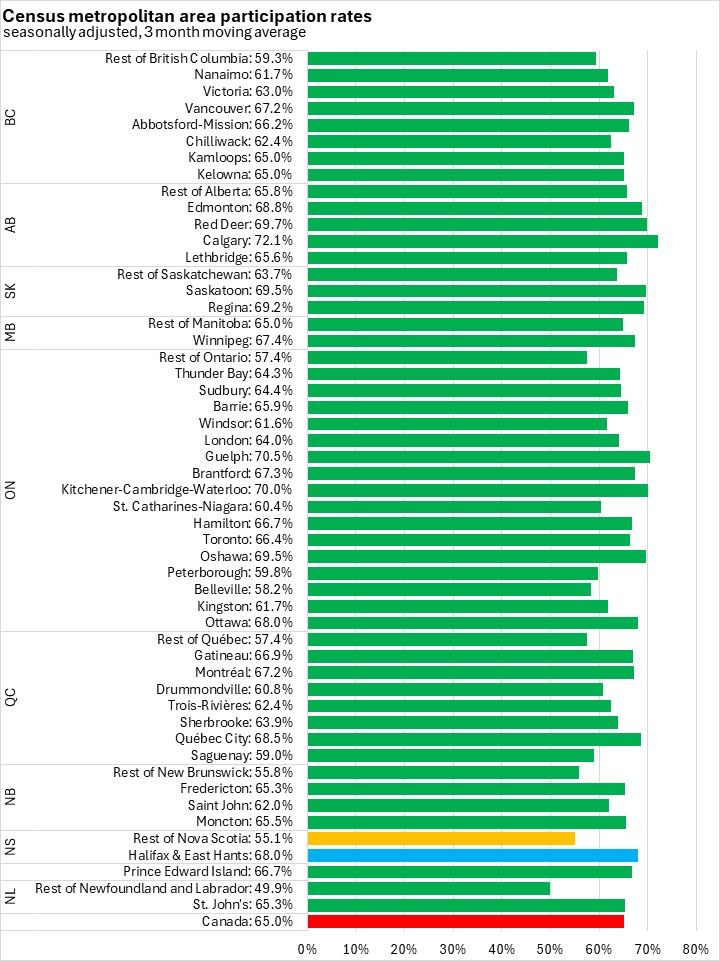
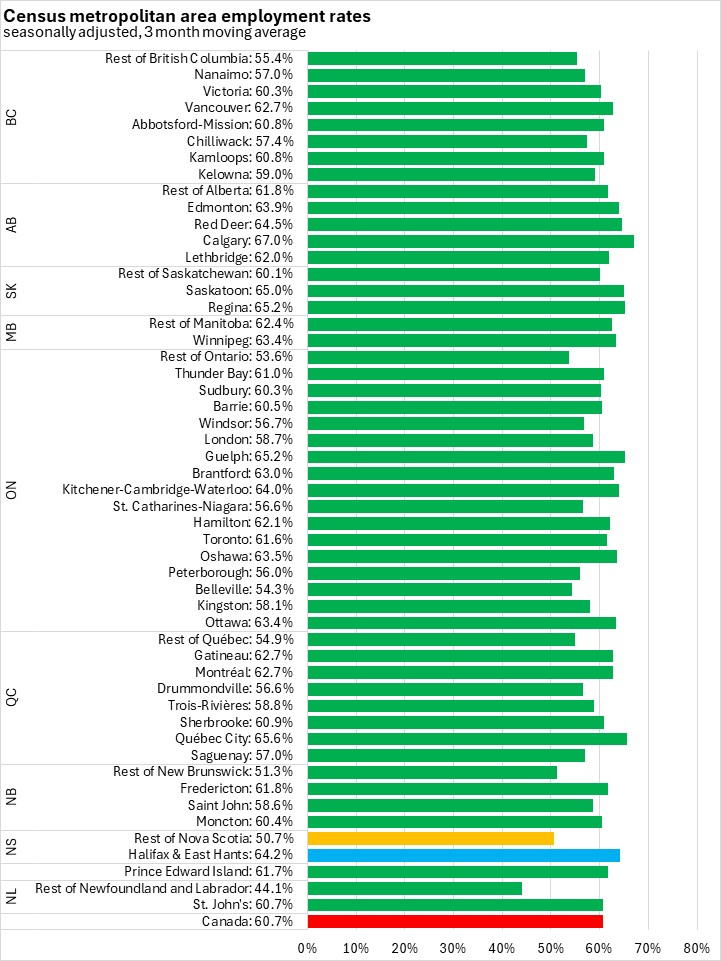
Census Metropolitan Areas (June 2026, seasonally adjusted 3 month moving average)
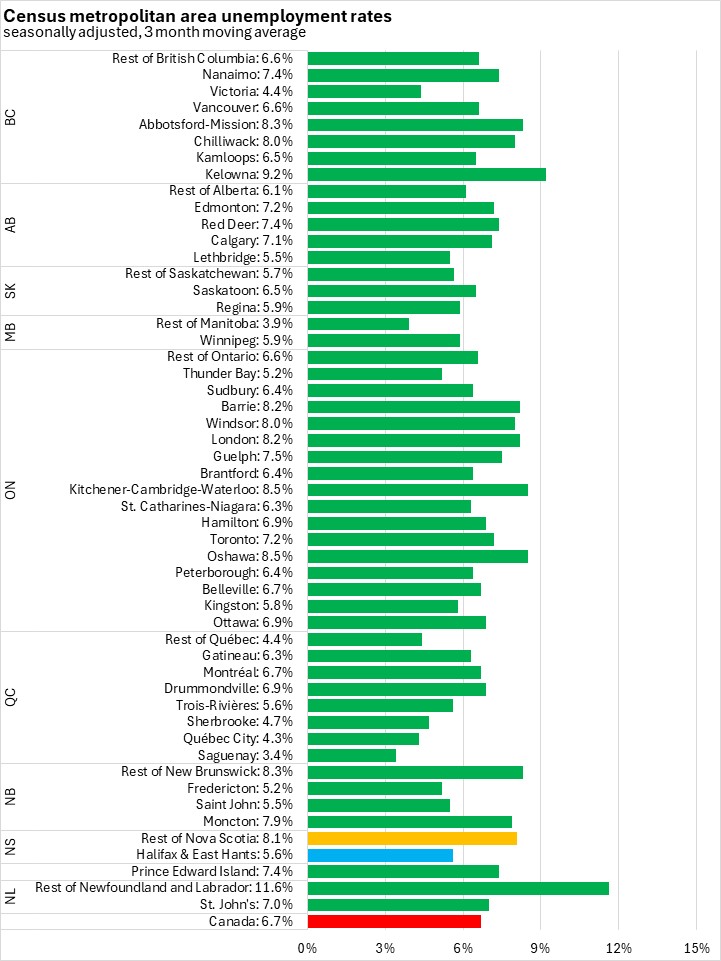
The Halifax & East Hants unemployment rate was 5.6% in the seasonally adjusted June 2026 three month moving average. Outside of Halifax & East Hants the unemployment rate was 8.1%. In central and western provinces, unemployment rates in Census Metropolitan Areas are similar to or higher than unemployment rates outside of CMAs. In the Atlantic Provinces unemployment rates are typically higher outside of CMAs.
Halifax & East Hant's participation rate was 68.0% in the seasonally adjusted June 2026 three month moving average, while participation rates were 55.1% across the rest of the province.
Halifax & East Hants reported an employment rate of 64.2% in the seasonally adjusted June 2026 three month moving average, while the employment rate was 50.7% outside the city.
Sources: Statistics Canada. Table 14-10-0036-01 Actual hours worked by industry, monthly, unadjusted for seasonality; Table 14-10-0063-01 Employee wages by industry, monthly, unadjusted for seasonality; Table 14-10-0287-01 Labour force characteristics, monthly, seasonally adjusted and trend-cycle, last 5 months; Table 14-10-0380-01 Labour force characteristics, three-month moving average, seasonally adjusted; Table 14-10-0387-01 Labour force characteristics, three-month moving average, unadjusted for seasonality, last 5 months; Table 14-10-0355-01 Employment by industry, monthly, seasonally adjusted and unadjusted, and trend-cycle, last 5 months (x 1,000); Table 14-10-0288-01 Employment by class of worker, monthly, seasonally adjusted and unadjusted, last 5 months (x 1,000); Table: 14-10-0459-01 Labour force characteristics, three month moving average, seasonally adjusted (x 1,000)