For additional information relating to this article, please contact:
October 01, 2026US PERSONAL INCOME AND OUTLAY, AUGUST 2026 Month over month (August vs July 2026, seasonally adjusted annualized rates)
US personal income grew by $66.6 billion (+0.24%) from July to August. Employee compensation was up $47.7 billion (+0.29%). There were gains in all other income categories. Personal disposable income was up $68.6 billion (+0.28%) while personal consumption expenditures (PCE) increased by $190.8 billion (+0.86%). US personal savings decreased by $122.2 billion (-10.99%).
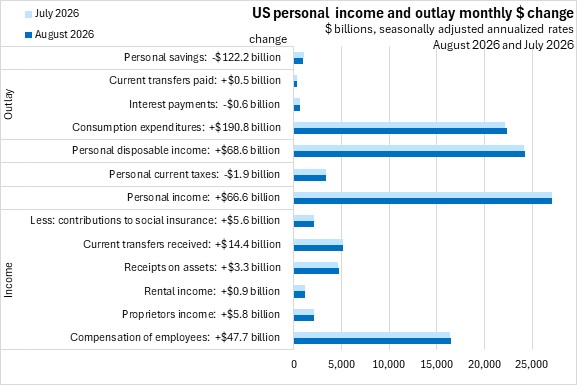
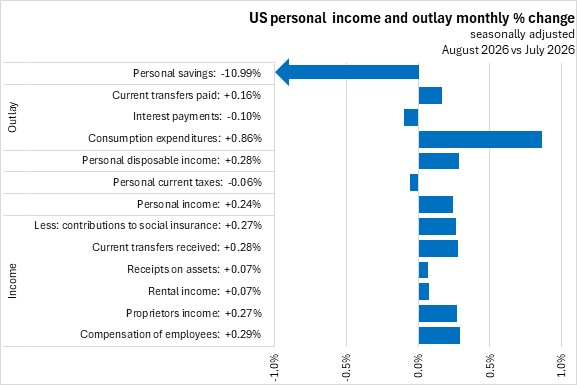
US personal income is calculated as the sum of employee compensation ($16.49 trillion), proprietors' income ($2.14 trillion), rental income ($1.20 trillion), receipts on assets ($4.71 trillion) and current transfers received ($5.20 trillion), less contributions to social insurance programs ($2.10 trillion). Personal income ($27.63 trillion) less personal current taxes ($3.40 trillion) equals disposable income ($24.22 trillion).
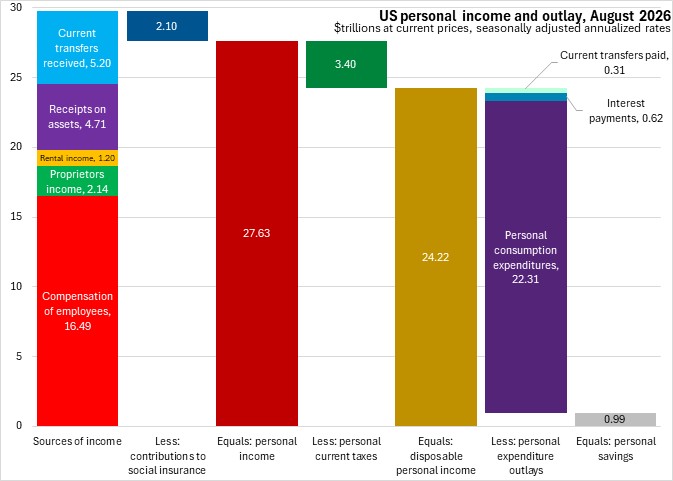
The outlay of US personal disposable income consists of personal consumption expenditures ($22.31 trillion), interest payments ($0.62 trillion) and current transfers paid ($0.31 trillion) with personal savings ($0.99 trillion) accounting for the remaining amount.
Trends
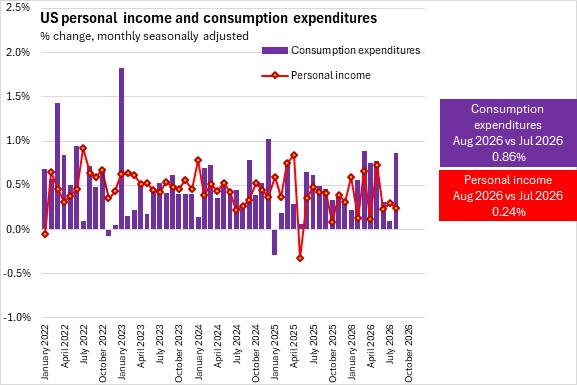
In eight of the last twelve months, personal consumption expenditures have grown faster than income.
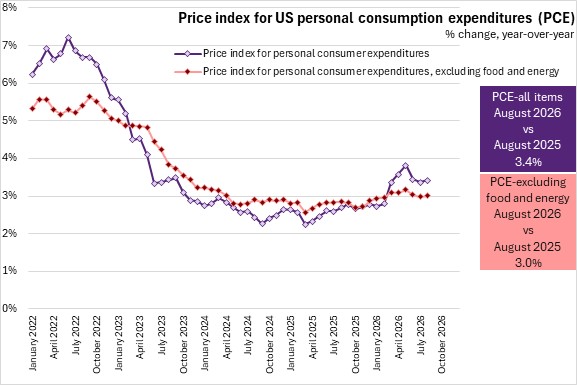
Growth in the price index for personal consumption expenditures (all items) was 3.4% year-over-year in August. Year-over-year growth in the price index for all items excluding food and energy was 3.0%. All items PCE inflation outpaced inflation for all items excluding food and energy for the sixth time since April 2023.
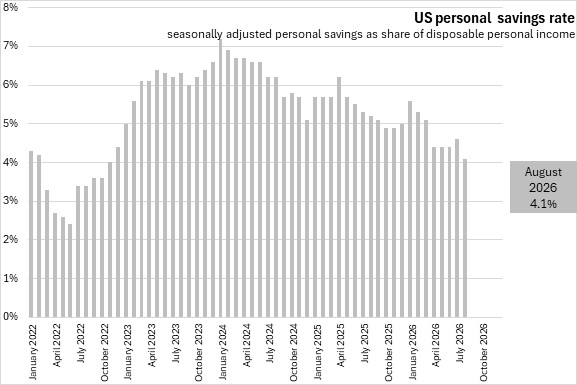
The US personal savings rate slowed to 4.1% of disposable personal income in August.
Year-to-date (January-August 2026 vs January-August 2025)
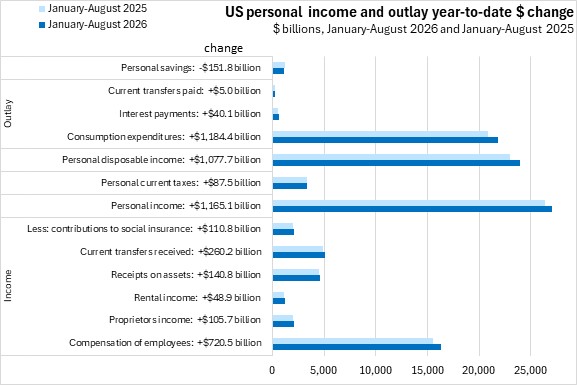
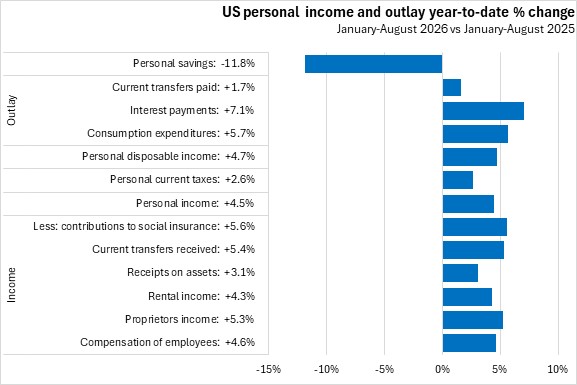
In January-July 2026, US personal income increased by 4.5% over its value in January-August 2025. There were gains from all income sources, led by growth in current transfers received (+5.4%). Personal consumption expenditures grew by 5.7%. Personal savings declined 11.8%.
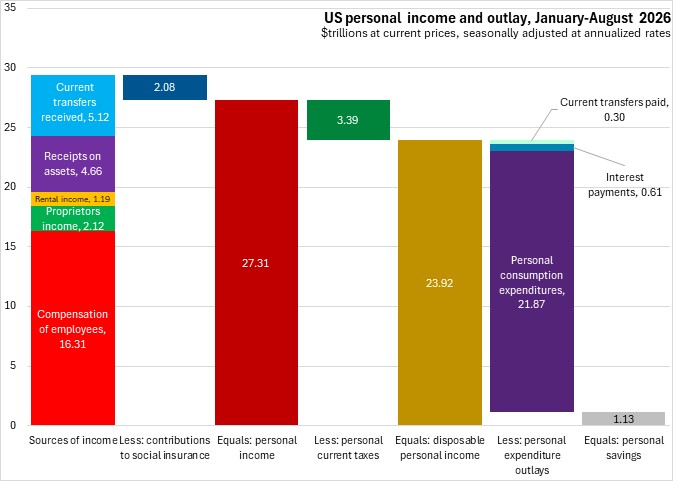
U.S. Bureau of Economic Analysis, "Table 2.6. Personal Income and Its Disposition, Monthly"; Data retrieved Federal Bank of St Louis